NatureScot Research Report 1289 - Enjoying the Outdoors - Monitoring the impact of Coronavirus and social distancing - Wave 3 survey results (September 2021)
Year of publication: 2022
Authors: Stewart, D. and Eccleston, J.
Cite as: Stewart, D. and Eccleston, J. 2022. Enjoying the Outdoors - Monitoring the impact of Coronavirus and social distancing - Wave 3 survey results (September 2021). NatureScot Research Report 876.
Keywords
visits to the outdoors; visits to the natural environment; participation in outdoor recreation; physical activity outdoors; benefits of visiting the outdoors; COVID-19; Coronavirus; lockdown; social distancing
Background and approach
In response to the Coronavirus pandemic, Scotland entered the first stage of lockdown on 23 March 2020 when a series of measures were put in place to slow the spread of the virus. At this point a stay at home message was central with only essential travel to be undertaken, outdoor visits for exercise limited to one per day and time to be spent only with other household members. This initial stage lasted until the 28 May 2020 when rules were relaxed to allow travel outside of local areas and for people from different households to meet outdoors whilst maintaining physical distancing.
Restrictions continued to ease in much of Scotland through the summer of 2020. Rising cases in some areas led to the continuation of certain measures, while stronger restrictions were implemented in places assigned the highest levels on the government’s 0 to 5 scale.
The vaccine rollout commenced in December 2020, but with rapidly rising levels of cases and hospitalisations, mainland Scotland entered a second lockdown on 5 January 2021. This lockdown stayed in place until 16 April 2021 when travel within Scotland for outdoor socialising, recreation and exercise in groups of up to six was permitted once again. Most remaining restrictions were eased on 19 July 2021 when all of Scotland moved to Level 0.
This research was commissioned to provide an understanding of outdoor visit behaviour and engagement with nature in Scotland during the Coronavirus crisis. Three waves of online surveying have been undertaken. The first involved 1,008 online interviews with a representative sample of adults in Scotland undertaken during the first week of June 2020, with respondents asked to focus on the initial period of lockdown from 23rd March to 28 May 2020. The second wave of research followed a comparable approach with 1,003 on-line interviews undertaken with a representative sample of the adult population plus 100 additional interviews with members of the minority ethnic (ME) population. Fieldwork for this second wave of research ran from 5 to 12 September 2020, with respondents asked to focus on outdoor visits and engagement with nature during the preceding 4 weeks.
This report presents the findings from a further, third wave undertaken a year later, with fieldwork running from 7 to 21 September 2021 and respondents asked to focus their responses on the preceding 4 weeks from around mid-August 2021.
Key findings
Participation levels
Frequency of participation in visits to the outdoors between mid-August and early September 2021 was higher than recorded during the initial lockdown period and broadly similar to that recorded at the same time of year in 2020 (77%, 80% and 71% in waves 3, 2 and 1 respectively).
10% of adults took no visits at all to the outdoors during August to September 2021, the same level as recorded during mid-August to early September 2020 but half the level recorded in the first period of lockdown in March to May 2020 when 19% of adults took no visits.
The nature of outdoor visits taken in August/September 2021 changed to some extent. Compared to the same period in 2020, a decreased percentage took walks of less than 8 miles but larger percentages took part in family outings or sightseeing/visiting attractions.
Data from the three survey waves suggests that levels of outdoor recreation activity have been returning to their pre-pandemic normal for many people. During August/September 2021 an increased percentage of the population reported that their levels of outdoor recreation had ‘not changed’ from what they would otherwise have done pre-pandemic, at the same time of year in 2019 (44% compared to 24% in wave 1 and 35% in wave 2).
However, 37% reported taking more visits to the outdoors than pre-pandemic. When these respondents were asked why the amount of time they spent outdoors had increased, the key reasons given were a ‘pent up’ demand following the easing of lockdown restrictions, increased levels of appreciation of the outdoors acquired during the pandemic, seeking to get fit/ exercise and having increased amounts of free time.
Benefits of time outdoors
The results from the latest wave suggest that the population is increasingly gaining and recognising the wellbeing benefits of time spent outdoors. When respondents were asked to what extent they agreed with a range of statements relating to the potential benefits of outdoor visits, 73% in Wave 3 stated that their time outdoors had helped them to de-stress, relax and unwind and 66% stated that it made them feel energised and revitalised. It is notable that both of these percentages had increased from those recorded in the 2020 waves.
Furthermore, when reflecting on the period since the pandemic began, almost three in five (58%) agreed that nature had become more important to their health and wellbeing, an increase from 49% in the first survey wave and 55% in the second.
People who had taken any visits to the outdoors for leisure, recreation or exercise were also asked whether they had experienced any issues that affected their enjoyment. Litter was by far the top answer, reported by almost half of respondents (48%). Other commonly experienced issues during this period, each mentioned by a quarter or more of outdoor visitors, were a lack of public toilet facilities (29%), cyclists on pavements (26%) and cars parked on pavements (25%). With the exception of litter, the incidence of all other issues covered in the survey had decreased since the previous wave.
Future intentions
In Wave 3, 48% stated that they expected to visit the outdoors more often in future than before the first lockdown. This percentage was similar to that recorded during both of the previous waves although it is notable that an increased share indicate that they were a ‘a lot more’ likely to do so,
The groups most likely to state that they expected to visit the outdoors more often in future included women (50%), those aged under 35 (56%), members of the ME population (62%), dog owners (54%) and those with very good health (55%).
While similar results were obtained for most of these population groups when this question was asked in Waves 1 and 2, it is notable that levels of interest in increasing time spent outdoors increased amongst the ME population from 48% in September 2020 to 62% in September 2021.
It is also notable that, during Wave 3, 64% of those people in employment who expect to work from home more often in future than they did before the pandemic also expected to increase their time spent outdoors the future, a significantly higher percentage than amongst people who currently work but do not expect to work from home in the future (45%).
28% of those who had worked from home during the last 4 weeks thought that doing so had an effect on the amount of time they spent outdoors for leisure, recreation or exercise or the types of activities they do. In around two thirds of these cases (i.e. of the 28%) respondents were visiting the outdoors more often, benefitting from increased time to do leisure due to a reduction in time commuting, enjoying being able to take a lunch time walk and/or being able to spend more time in their garden.
Looking to the future, 38% of people who work full or part time stated that they expected to work from home more often in the future than they did before the pandemic. It may be that this longer term adjustment in working patterns will lead to some longer term changes to outdoor recreation behaviours.
Background
In response to the Coronavirus pandemic, Scotland entered the initial phase of lockdown on 23 March 2020 with a series of measures put in place to slow the spread of the virus.
A ‘stay at home’ message was central with only essential travel to be undertaken, outdoor visits for exercise limited to one per day, and this time to be spent alone or with other household members only.
A relaxation in these restrictions was announced on 10 May 2020 permitting people to go outdoors for exercise as many times a day as they wished whilst continuing to go only to local places.
This initial lockdown period was in place continuously from 23 March until 28 May 2020 when some restrictions were eased as Scotland entered Phase One of the Route Map out of the crisis. With these eased restrictions it became possible for visits to the outdoors to be taken to places outside of local areas and for people from different households to meet outdoors whilst maintaining physical distancing.
Whilst restrictions continued to ease in much of Scotland through the summer of 2020, rising case numbers in some areas led to the continuation of restrictions and stronger restrictions in certain parts of the country.
The vaccine rollout commenced in December 2020 but with rapidly rising levels of cases and hospitalisations, mainland Scotland entered a second lockdown on 5 January 2021. This lockdown stayed in place until 16 April 2021 when travel within Scotland for outdoor socialising, recreation and exercise in groups of up to six was permitted.
Most remaining restrictions were finally eased on 19 July 2021 when all of Scotland moved to Level 0.
More details on the Covid-19 requirements relating to outdoor recreation during each survey period are provided in Table 2 below.
Objectives
During the early weeks of the first lockdown, anecdotal evidence suggested that more people than usual were spending time in nature and visiting local greenspaces and countryside close to home, with increased usage driven by the substitution of indoor leisure pursuits with outdoor exercise and a desire to obtain health and wellbeing benefits.
To understand, measure and track this perceived change, NatureScot, in partnership with Scottish Forestry, Cairngorms National Park Authority and Paths for All, commissioned 56 Degree Insight to undertake a survey of a representative sample of adults living in Scotland.
Three waves of surveying have been conducted to provide an accurate measure of outdoor visit behaviour and engagement with nature during the period. The first wave focused on the initial period of lockdown between 23 March and 28 May 2020, the second focused on the period from mid-August to early September 2020 while the third was undertaken almost exactly a year later.
| - | Fieldwork period | Period focused upon in questions | Sample size |
|---|---|---|---|
| Wave 1 | 29 May to 5 June 2020
| 23 March to 28 May 2020
| 1,008 |
| Wave 2 | 5 to 12 September 2020
| ‘Last four weeks’ (i.e. mid August to mid September 2020)
| 1,103 |
| Wave 3 | 7 to 21 September 2021
| ‘Last four weeks’ (i.e. mid August to mid September 2021) | 1,106 |
Specific areas addressed in the survey included the following:
How behaviour changed during the Coronavirus crisis:
- Frequency of visiting the outdoors
- Amount of time spent outdoors
- Profile of outdoor visitors
- Details of visits (places, activities, distances travelled, party composition).
How attitudes to the outdoors changed during the Coronavirus crisis:
- Motivations for spending time outdoors
- The benefits obtained from spending time outdoors
- Experience of local outdoor places
- The importance of having access to a garden/other outdoor space
How other engagement with nature changed during the Coronavirus crisis:
- Noticing and enjoying everyday nature
- How is engagement with nature benefitting people?
What longer term changes might we see in the future?
- How will people use their local greenspaces in the future?
- How will people engage with nature in the future?
To what extent have changing working from home patterns and the effects of the pandemic of household finances impacted upon outdoor recreation behaviours
In addition to these topics the questionnaire used during each survey wave included a series of demographic questions to allow profiling of responses and comparisons between population groups. This included the addition of questions on vaccine status and propensity to work from home added in Wave 3.
Changing Covid-19 related rules and guidance
When interpreting the results from each of the three waves of this survey it is important to consider the status of the Covid-19 pandemic and the Scottish Government rules and guidance in place during each time period.
Table 2 provides a summary of the rules and guidance for the time periods respondents were asked to report upon during each wave. More details on Scotland’s Covid-19 timeline are available on the SPICe Spotlight web page.
| - | Period focused upon in questions | Summary of Covid-19 Rules/ Guidance relevant to outdoor recreation |
|---|---|---|
| Wave 1 | 23 March to 28 May 2020
| Scotland entered the first stage of lockdown on 23 March when a series of measures were put in place to slow the spread of the virus. At this point a stay at home message was central with only essential travel to be undertaken, outdoor visits for exercise limited to one per day and time to be spent only with other household members. This initial stage of lockdown lasted until the 28th May 2020 when rules were relaxed to allow travel outside of local areas and for people from different households to meet outdoors whilst maintaining physical distancing. |
| Wave 2 | Mid August to mid September 2020.
| During most of this period Scotland was in Phase 3 of the roadmap out of lockdown. Limits were in place on the number of people who could meet outdoors (max 5 households/ 15 people) and 2 metre social distancing was still required. Travel restrictions had been relaxed allowing journeys of more than 5 miles to be taken for leisure purposes. Indoor sports facilities re-opened from 31 August. |
| Wave 3 | Mid August to mid September 2021.
| During all of this period Scotland had moved out of the Covid-19 levels system to what was called ‘beyond Level 0’ and rules relating to outdoor recreation had been relaxed. However the Scottish Government continued to recommend careful and cautious behaviours including meeting outside if possible and keeping your distance from people not in your group. |
Methodology
Each wave of surveying was undertaken using an online approach with demographic quotas applied to provide a nationally representative sample of the adult population aged 16 and over. The second and third waves also included a ‘booster’ sample to increase the number of people in the minority ethnic (ME) population included in the survey sample.
To correct for any variations which existed between the sample and the Scottish adult population, demographic weighting was applied at the analysis stage using target weights based on gender, age, socio-economic status, region of residence and (in Waves 2 and 3) ethnicity.
Data collection was delivered in partnership with consumer panel provider Dynata with a total of 1,008 on-line interviews conducted in the first wave between Friday 29 May and Friday 5 June 2020,1,103 in the second wave between Saturday 5 September and Saturday 12 September 2020 and 1,106 in the third wave between Tuesday 7 September and Monday 20 September 2021.
Table 3 shows the final unweighted and weighted sample profile during the third survey wave which took place from 7 to 21 September 2021. A similar profile was obtained in waves 1 and 2.
| - | Unweighted sample | Weighted sample profile |
|---|---|---|
| Gender | - | - |
| Male | 508 (46%) | 48% |
| Female | 595 (54%) | 52% |
| Prefer not to say | - | - |
| Age band | - | - |
| 16-34 | 252 (23%) | 29% |
| 35-54 | 399 (36%) | 32% |
| 55+ | 455 (41%) | 39% |
| Socio-economic group | - | - |
| ABC1 | 579 (52%) | 52% |
| C2DE | 527 (48%) | 48% |
| Region | - | - |
| West | 443 (40%) | 45% |
| South | 58 (5%) | 5% |
| East | 419 (38%) | 35% |
| North | 186 (17%) | 15% |
| Ethnicity | - | - |
| White | 991 (90%) | 95% |
| Minority ethnic | 115 (10%) | 5% |
| Total sample | 1,106 (100%) | - |
During data analysis respondent postcodes were matched with a number of publicly available classifications. Specifically, respondents were classified as follows:
- Scottish Index of Multiple Deprivation (SIMD) - respondents were grouped on the basis of residency in the 10% most deprived areas, the 10% least deprived areas and the middle 11% to 89% areas. (More information about SIMD is available here.)
- Scottish Government urban/rural classification – respondents were classified using the six-fold classification ranging from large urban populations to remote rural populations. (More information about the urban/rural classification is available here.)
- Central Scotland Green Network – respondents were coded to identify if they lived within the CSGN area.
A number of other demographic variables were recorded in the survey and also used in the analysis of results. The full questionnaire used is included in Annex 1.
Participation in outdoor recreation during lockdown
Frequency of outdoor visits
The frequency of visits to the outdoors (for leisure, recreation or exercise) during the mid-August to early September 2021 period was higher than recorded during the initial lockdown period and broadly similar to that recorded at the same time a year ago (77%, 80% and 71% respectively).
Correspondingly, while 19% of adults took no visits at all to the outdoors in the March to May 2020 period, this percentage almost halved to 10% during mid-August and early September 2020 and remained at this level during August to September 2021.
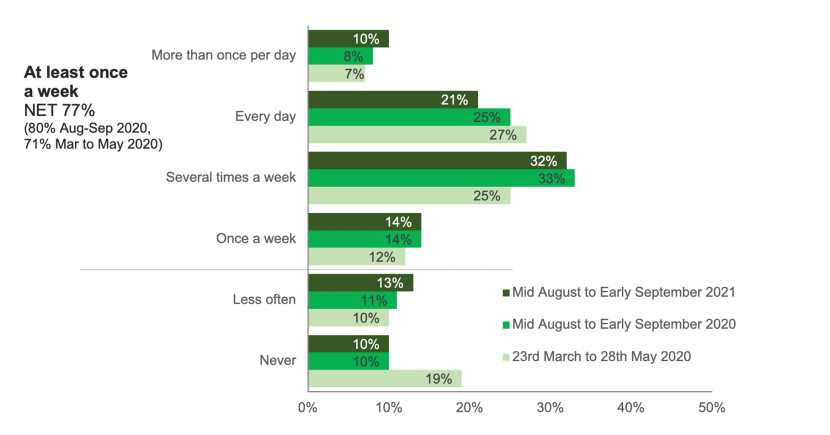
Figure 1: Frequency of visits to the outdoors for leisure, recreation or exercise during lockdown/ last 4 weeks
Click for a full description
Bar chart illustrating the general frequency of visits taken to the outdoors by the population during each of the three survey periods, ranging from percentages taking visits daily to percentages taking no visits.
Between mid-August and early September 2021, younger age groups, residents of the least deprived areas, members of the more affluent socio-economic groups, dog owners and people who reported having good health were the most likely to take visits on a regular basis.
Conversely, those aged 55 and over, those living in the most deprived areas and those not in good health were the most likely to have taken no outdoor visits at all.
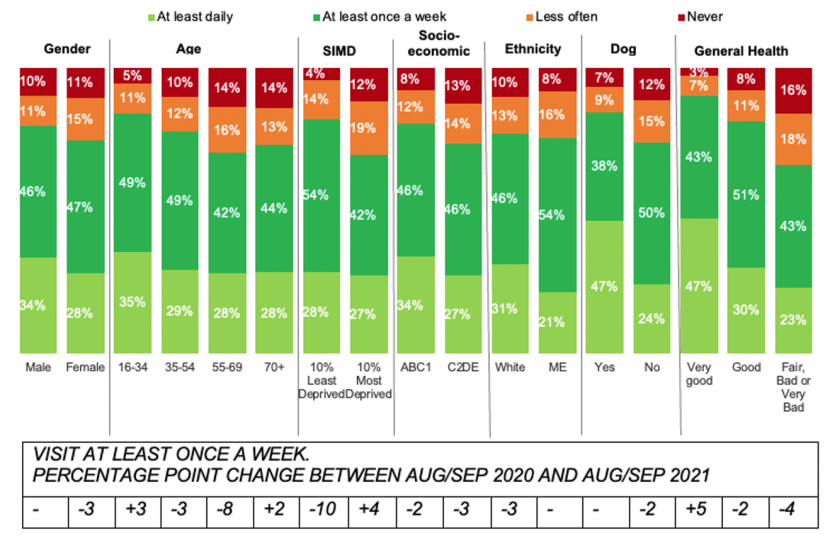
Figure 2: Frequency of visits to the outdoors for leisure, recreation or exercise during last 4 weeks by key demographic
Click for a full description
Stacked column chart comparing frequency of visits taken to the outdoors during the last 4 weeks amongst different demographic groups. This includes results shown by gender, age, SIMD, socio-economic status, ethnicity, dog ownership and general health status.
While the percentage of the total adult population taking visits at least once a week was 77% in August-September 2021, a slightly lower percentage than in 2020 (80%), a comparison of changes in frequency of participation amongst different demographic groups reveals some larger changes amongst certain groups:
- By gender – the percentage of women spending time outdoors at least once a week decreased from 78% to 75% between 2020 and 2021 while there was no change amongst men.
- By age – the percentage of people aged 70+ who never spent any time outdoors decreased from 22% to 14% between 2020 and 2021. This change may reflect increasing confidence amongst this older age group as the vaccine roll out progressed.
- By SIMD – the percentage of people living in the least deprived areas who visited the outdoors at least once a week decreased from 92% in 2020 to 82% to in 2021. This change may in part be driven by a decrease in the percentage of working people who were working from home.
Figure 3, below, illustrates frequency of visits taken in the last 4 weeks amongst people who work full time or part time, comparing those who did not work at home during this period with those who worked at home for up to half of their working hours and those who worked from home for more than half of their hours.
This comparison shows that people who worked from home for some of but less than half of their working hours were the most likely to take visits to the outdoors at least daily (44%) while people who never worked from home were the most likely to taken no outdoor visits during this period (11%).
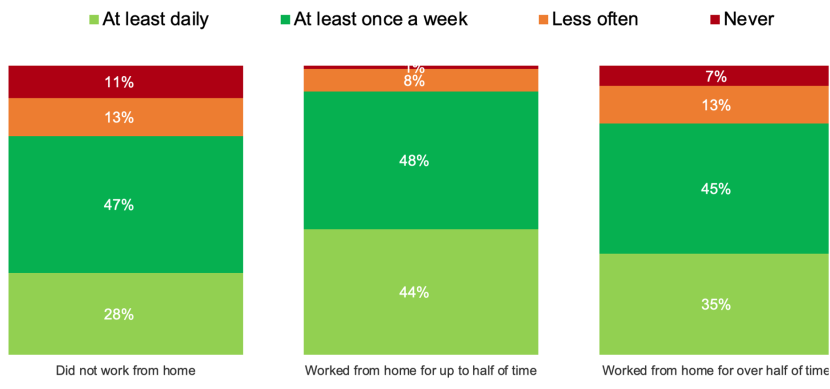
Figure 3: Frequency of visits to the outdoors for leisure, recreation or exercise during last 4 weeks by proportion of time spent working from home
Click for a full description
Stacked column chart showing frequency of visits taken to the outdoors during the last 4 weeks amongst working people surveyed in Wave 3. Results compared for those who worked from home over half the time, those who worked from home for less than half of their time and those who did not work from home at all.
Changing outdoor visit behaviours during the pandemic
It is possible to compare reported frequency of visits to the outdoors during the periods covered by this series of surveys with broadly comparable periods in 2019 as recorded in the most recent Scotland’s People and Nature Survey (SPANS). While some caution should be exercised when making comparisons (due to differences in the survey methodologies and question wording) this provides some indication of how visit taking levels have changed during 2020 and 2021.
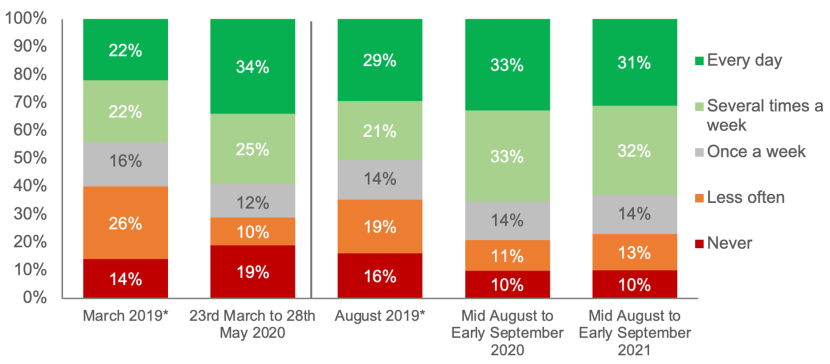
Figure 4: Frequency of visits to the outdoors for leisure, recreation or exercise during last 4 weeks/ lockdown compared to March 2019 and August 2019.
Click for a full description
Stacked column chart comparing frequency of visits taken to the outdoors recorded during each of the three waves of the Covid-19 survey against results from waves of the Scotland’s People and Nature Survey which was undertaken before the pandemic in 2019.
This comparison suggests that in the initial March to May 2020 lockdown period frequency of outdoor visit taking became much more polarised than normal with a significantly increased percentage of people taking visits every day (34% during lockdown compared to 22% reported in SPANS in March 2019) but also an increased percentage of people taking no visits at all (19% during lockdown compared to 14% reported in SPANS in March 2019).
Comparison of the frequency of visits taken from mid-August to early September 2020 with the SPANS results for August 2019 shows that, with the easing of many restrictions in 2020, the percentage of people taking regular outdoor visits increased while the percentage visiting infrequently or not at all was lower than might have been expected for the time of year.
The 2021 results suggest a continuation of the trend towards higher levels of outdoor recreation participation in comparison to those recorded for the same period in 2019. As discussed in more detail in the sections that follow, this continuation may in part be explained by a proportion of the population establishing new habits, perhaps due to an increased amount of their time spent working from home.
Respondents were also asked if the amount of time they had spent outdoors for leisure, recreation or exercise during the pandemic had increased or decreased compared to the same time of year in 2019.
During the mid-August to early September 2021 period, 37% of the population reported an increase in the amount of time they had spent outdoors during the previous four weeks compared to the same period two years previously in 2019, a slightly lower percentage than was recorded in September 2020 (40%).
However, an increasing percentage of the population reported that their levels of outdoor recreation were not changed from the same time of year in 2019 (24% in wave 1 to 35% in wave 2 and 44% in wave 3). This trend suggests that levels of outdoor recreation activity were returning to their pre-pandemic normal for many people.
By comparison, during the initial March to May lockdown period, a much higher percentage of adults (30%) reported that the amount of time they had spent outdoors had ‘decreased a lot’.
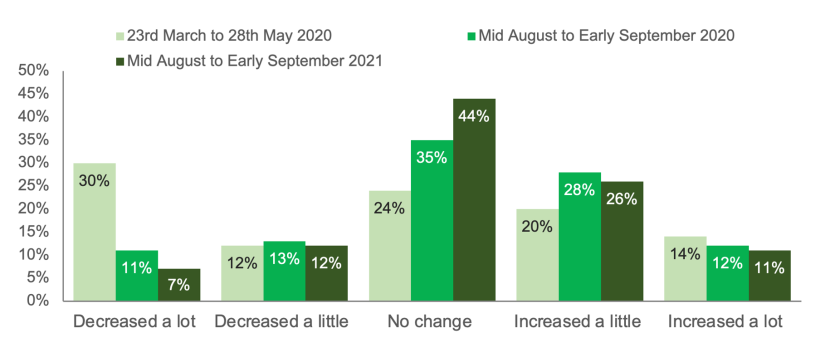
Figure 5: Amount of time spent outdoors for leisure, recreation or exercise during the last 4 weeks / lockdown compared to the same period in 2019.
Click for a full description
Column chart showing claimed changes in time spent outdoors during each of the three survey periods in comparison to the same time of year in 2019. Results are compared for each of the three waves with answer options including Decreased a lot, Decreased a little, No Change, Increased a little and Increased a lot.
The groups most likely to report spending more time outdoors between mid-August and early September 2021 than in the same period in 2019 were women (40% increased a lot or a little), those aged 16 to 34 (44%), people reporting very good general health (46%), people who reported working from home more often than before the pandemic (50%) and dog owners (46%). Related to this finding, levels of dog ownership recorded by the survey remained at similar levels across all three waves – 28% in May/June 2020, 31% in September 2020 and 29% in September 2021.
In contrast, the groups most likely to have decreased their time outdoors during this period included those aged 70 or over (26% decreased a lot or a little) and those who reported having fair, poor or very poor health (28%).
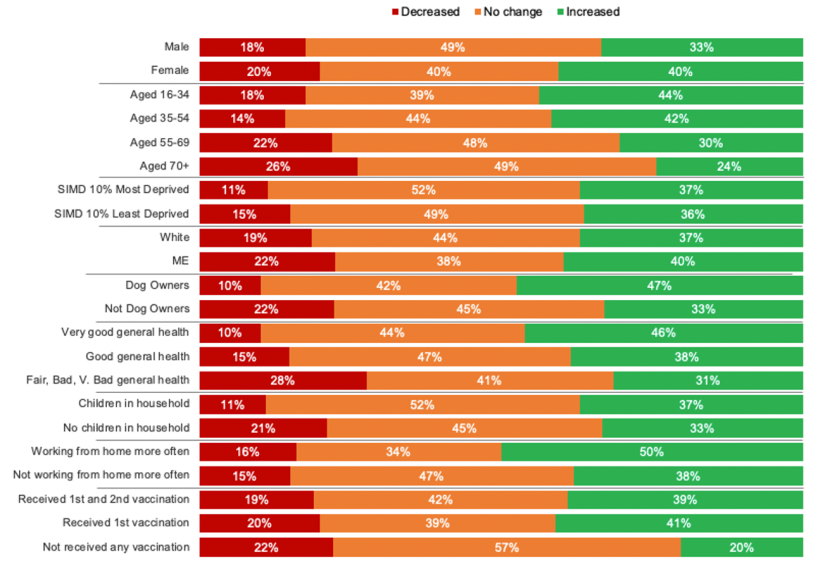
Figure 6: Amount of time spent outdoors for leisure, recreation or exercise during the last 4 weeks compared to the same period in 2019 by population group.
Click for a full description
Stacked chart showing claimed changes in time spent outdoors during Wave 3 amongst key population groups. Results are summarised for each group to show percentages reporting spending Less time, No change in time or More time outdoors.
This includes results shown by gender, age, SIMD, ethnicity, dog ownership, general health status, presence of children in household, working from home and vaccination status.
Figure 7, overleaf, compares the net change in time spent outdoors reported by different groups of respondents during each of the three survey waves. These net figures are calculated by subtracting the percentage of the population in each group who spent less time outdoors than in the same period in 2019 from the percentage who spent more time outdoors. For example, as shown in Figure 6 above, 18% of men spent less time outdoors than in 2019 in the mid-August to early September 2021 period while 33% spent more time outdoors than in 2019 - so the net change shown for this period in Figure 7 is +15 (i.e. 33-18=15).
This analysis illustrates how during the mid-August to early September 2021 period the overall positive net change in time spent outdoors across the population as a whole was +18 compared to the same period in 2019. However, the net change compared to the same period in 2019 was much higher amongst those aged 16-34 and 35-54, residents of the most deprived SIMD areas, dog owners and people in good health.
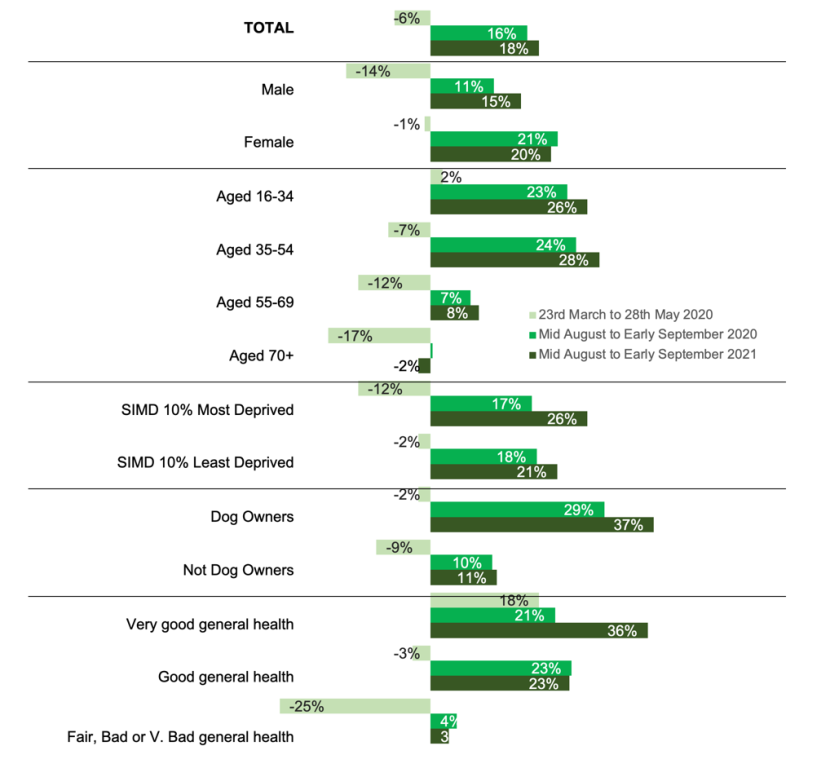
Figure 7: Net change in amount of time spent outdoors for leisure, recreation or exercise during the last 4 weeks/ lockdown compared to the same period in 2019 by population group.
Click for a full description
Bar chart which compares the net change in time spent outdoors amongst different demographic groups of interest during each of the three survey waves.
This includes results shown by gender, age, SIMD, dog ownership and general health status.
Respondents were also asked if the amount of time they spent outdoors within their local area had changed during the Coronavirus crisis. During the mid-August to early September 2021 period, 40% of adults reported spending more time outdoors within their local area than in 2019 while 43% reported no change in their time spent outdoors locally. The remaining 18% had spent less time outdoors locally than in same period in 2019. Taken together these findings suggest a slight swing in favour of more time spent outdoors in local area than before the pandemic.
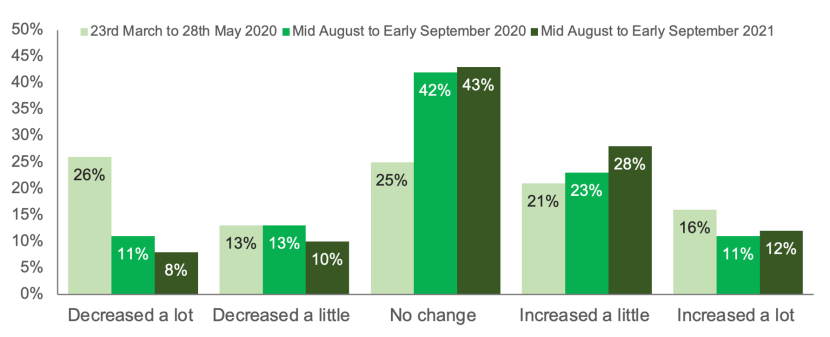
Figure 8: Amount of time spent outdoors in local area for leisure, recreation or exercise during the last 4 weeks/ lockdown compared to the same period in 2019.
Click for a full description
Column chart showing claimed changes in time spent outdoors locally during each of the three survey periods compared to the same time of year in 2019. Results are shown for each of the three waves with answer options including Decreased a lot, Decreased a little, No Change, Increased a little and Increased a lot
When respondents were asked why the amount of time they spent outdoors between mid- August and early September 2021 had changed in comparison to the same period in 2019, a wide range of responses were provided.
This question was asked in an open-ended format with responses coded into the categories shown in Figure 9; a selection of the full verbatim answers is also available.
Amongst those who spent more time outdoors during this period, the key reasons given were a ‘pent up’ demand following the easing of lockdown restrictions, increased levels of appreciation of the outdoors acquired during the pandemic, seeking to get fit/ exercise and having increased amounts of free time. Overall 4% stated that they increased their time outdoors because they were working from home but this increased to 10% amongst people still working from home for at least half of their working hours.
However, amongst those who spent less time outdoors during this period, the key reasons given were: continued adherence to rules, general health or old age issues and/or continued nervousness about going outside due to the risks of infection or transmission. Concerns relating to Covid ‘rules’ or nervousness about the virus were most commonly mentioned by people aged 65+.
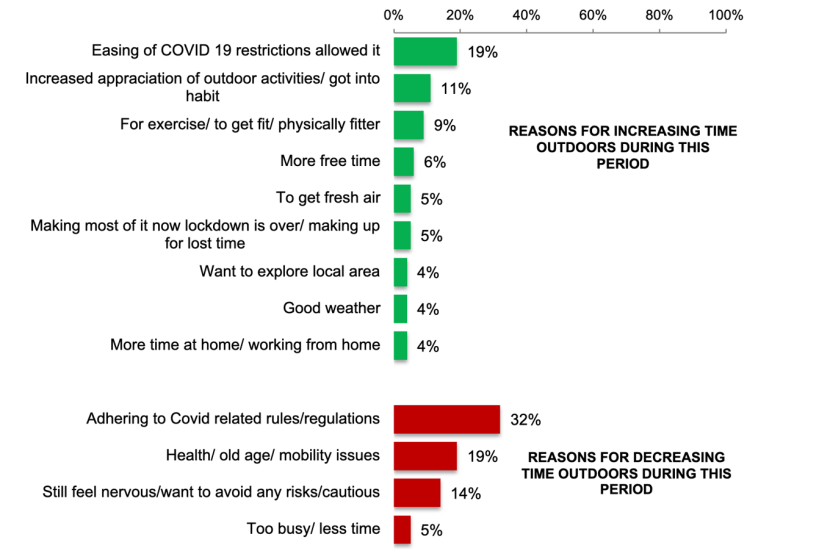
Figure 9: Reasons for changing amount of time spent outdoors during last 4 weeks compared to the same period last year.
Click for a full description
Bar chart showing the most frequently provided reasons given in Wave 3 for either increasing or decreasing time spent outdoors comparted to 2019.
Some examples of the responses provided to this question are shown below:
Reasons for increasing time outdoors
Increased appreciation
“During lockdown we enjoyed being able to get out the house to exercise and have found a new love/ appreciation for the outdoors and our local areas.”
“I found a love for being outside and in nature during Covid when there was nothing else to do.”
“I have realised how much I enjoy it through doing it during lockdown. I have also taken up cycling with my family.”
For health
“I think it’s now very important to get outside everyday, get some fresh air and some general walking. It’s all very good for you, lockdown taught me how important it was to take care of your mental health as well as your physical health.”
“I decided to make an active effort to do more exercise and also get my child and dog out.”
Reasons for decreasing time outdoors
Health/ old age/ mobility
“My health got worse and lockdown meant I was shielding.”
“Hip replacement surgery limited my mobility.”
Still feeling nervous
“I am just trying to stay away from crowded places to keep me and my family safe.”
“I do not want to be near other people. I do not feel like being outside.”
Activities undertaken
Respondents who had spent any time outdoors for leisure, recreation or exercise between mid-August and early September 2021 were asked a series of questions regarding their experiences.
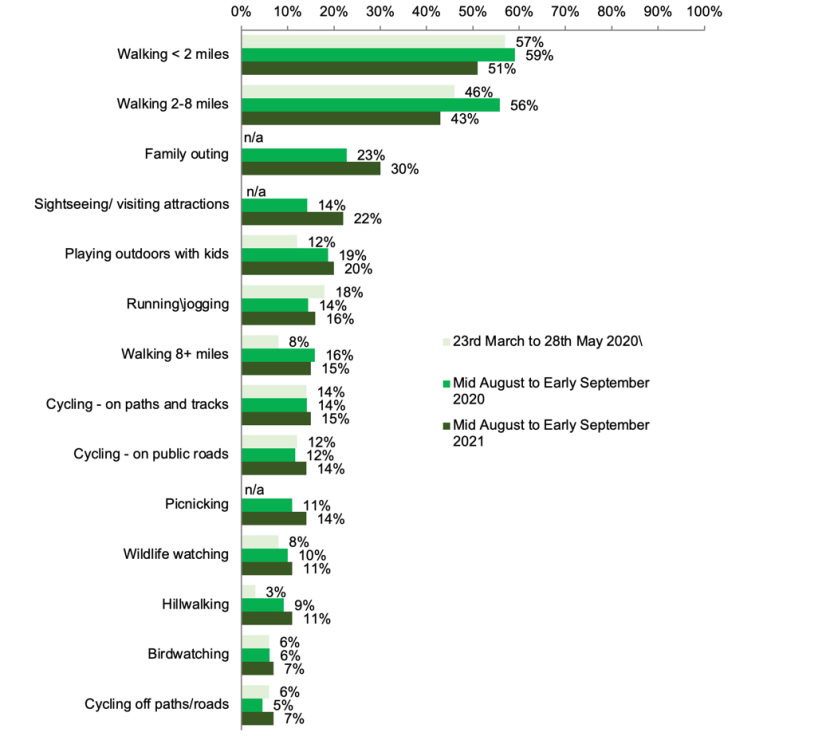
Figure 10: Activities undertaken outdoors for leisure, recreation, or exercise during last 4 weeks/lockdown.
Click for a full description
Bar chart illustrating the activities undertaken during visits taken to the outdoors during each of the three survey periods. 14 activity types are included.
The vast majority of those visiting the outdoors between mid-August and early September 2021 took part in walking (79%), with the largest percentages taking walks of less than 2 miles (51%) and/or walks of between 2 and 8 miles (43%). The other most frequently undertaken activities were family outings (30%) and playing outdoors with children (20% overall but 42% amongst those with children in the household).
Compared to the same period in 2020, a decreased percentage took walks of less than 8 miles, but larger numbers had taken part in family outings or sightseeing/visiting attractions.
Figure 10 excludes activities undertaken by less than 5% of respondents – these included fishing (which was undertaken by 4% of respondents), watersports (3%), and horse riding (2%).
A comparison with SPANS data collected in broadly comparable periods in 2019 (Table 4) provides an indication of changes in participation in different types of outdoor activities during the Coronavirus crisis (although, as mentioned previously, caution should be exercised when making comparisons due to differences in survey methodologies and question wording).
This comparison suggests that during both the March to May 2020 and mid-August to early September 2020 periods, participation in walking, cycling and running were much higher than pre-pandemic but overall levels have now returned to a level closer to ‘normal’.
| - | May 2019* | March/ May 2020 | July 2019* | Mid Aug/ Early Sep 2020 | Mid Aug/ Early Sep 2021 |
|---|---|---|---|---|---|
| Any Walking | 77% | 89% | 80% | 89% | 79% |
| - Walking < 2 miles | 34% | 57% | 34% | 59% | 51% |
| - Walking 2-8 miles | 40% | 46% | 43% | 56% | 43% |
| - Walking 8 miles or more | 4% | 8% | 3% | 16% | 15% |
| - Hillwalking | 3% | 3% | 4% | 9% | 11% |
| Any Cycling | 8% | 22% | 7% | 21% | 24% |
| Running/ jogging | 5% | 18% | 5% | 14% | 16% |
* May and July 2019 data sourced from Scotland’s People and Nature Survey 2019/20
To obtain a clearer view on how levels of participation in specific outdoor activities changed during this period, respondents were also asked how much time they had spent doing each activity during the Coronavirus crisis compared to the same time in 2019.
The findings, shown in Figure 11, exclude those respondents who stated that a specific activity was ‘not relevant’ to them as they never participated. The net change (i.e. the proportion of respondents stating that they increased the amount of time participating minus the proportion who decreased the amount of time participating for each activity) is shown for each of the three survey waves. For example the net change for August to September 2021 for playing outdoors with children is +25.
Overall, net positive changes were recorded in the mid-August to early September 2021 period for nearly every activity, most notably playing outdoors with children (+25%), going for short walks of less than 2 miles (+24%), wildlife/nature watching (+23%), running/jogging (+20%) and birdwatching (+19%).
Notably a number of the activities which recorded a very small or no net increase in September 2020 (including sightseeing, family outings, picnicking and walks of 8+ miles) recorded net increases as increasing numbers of people venture further from home and take part in days out and holidays in Scotland.
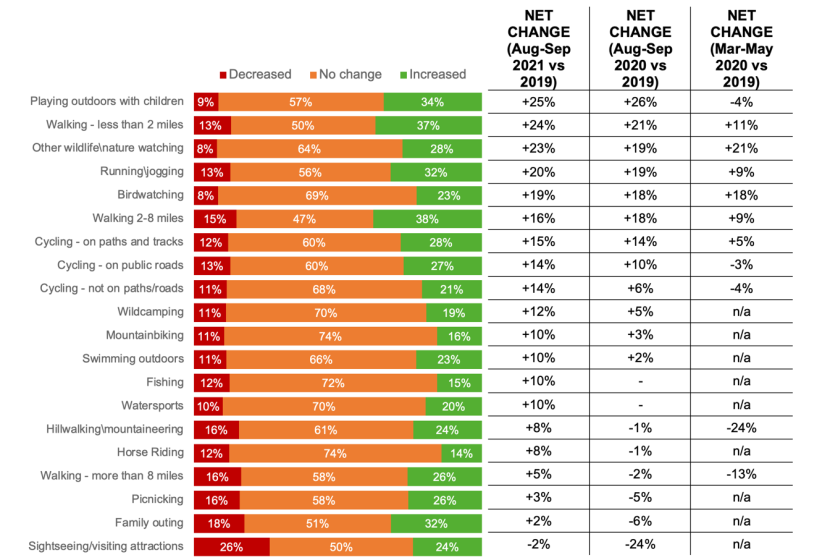
Figure 11: Amount of time spent undertaking outdoor activities during last 4 weeks compared to 2019
Click for a full description
Stacked chart showing claimed changes in time spent outdoors undertaking different types of outdoor activity during Wave 3 (14 activity types are included). Includes a net change for each activity which is compared with the net change recorded in the two previous survey waves.
Places visited
Those who had spent any time outdoors for leisure, recreation or exercise during the last 4 weeks were also asked to indicate the types of places they had visited on these trips.
As illustrated in Figure 12, during the mid-August to early September 2021 period, the largest proportions of respondents had spent time outdoors in local parks and open spaces (51%), on paths and tracks away from a roadside (36%), on pavements alongside a road or street (36%), in woodland and forests (34%) or on beaches (28%).
Compared to the same time of year in 2020, a slightly reduced percentage took visits including paths and tracks either beside or away from roads.
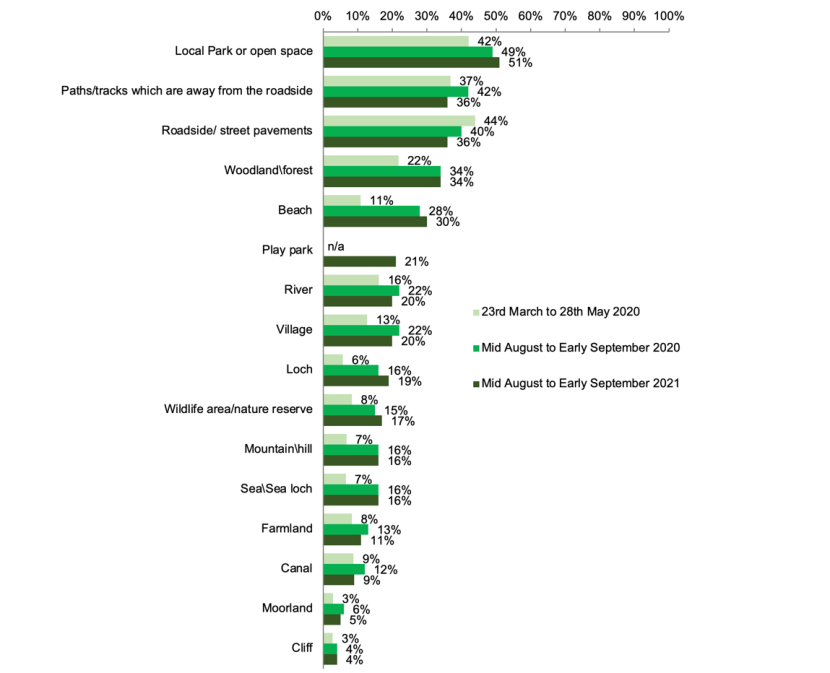
Figure 12: Places visited to take part in outdoor leisure, recreation or exercise during last 4 weeks/lockdown
Click for a full description
Bar chart illustrating the types of places visited during time spent outdoors during each of the three survey periods. 16 types of place are included.
Respondents were also asked how the amount of time they spent in different places compared to the same period in 2019. The findings, shown in Figure 13, exclude those respondents who stated that a specific place was ‘not relevant’ to them as they had never visited. The net change (i.e. the proportion of respondents stating that they increased the amount of time spent in different places minus the proportion who decreased the amount of time) is shown for all three survey periods.
Overall, the largest positive net changes were recorded for local parks or open spaces (+29%), path/tracks away from the roadside (+22%), play parks (+19%) and woodland and forests (+18%).
Unlike the previous survey periods, no net decreases were recorded for visits to any of the types of places.
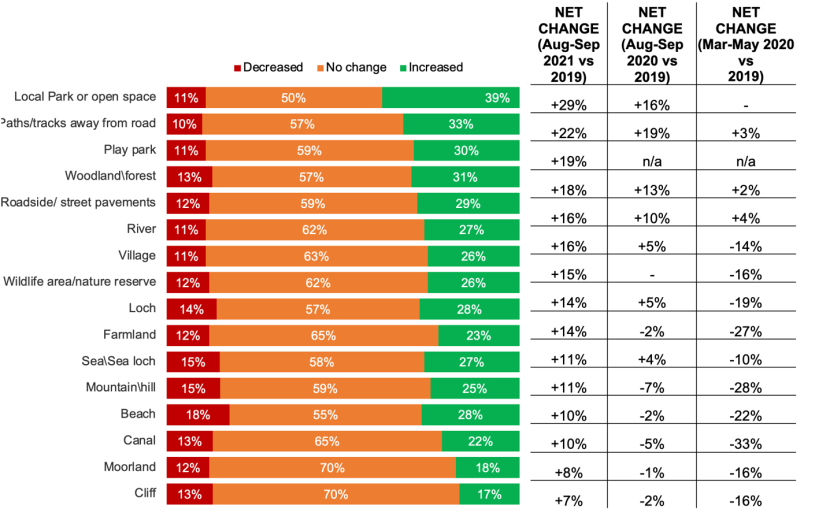
Figure 13: Amount of time spent visiting outdoor places during last 4 weeks compared to 2019
Click for a full description
Stacked chart showing changes in time spent outdoors in different types of place (16 activity types are included). Includes a net change for each type of place which is compared with the net change recorded in the two previous survey waves.
It is notable that across all three survey waves local parks and open spaces have been the most visited type of place and this type of place has recorded the greatest net increase in usage. This net increase is +29 cross the total population but even higher amongst people aged 16 to 34 (+43%), members of the ME population (+39), residents of the 10% most deprived areas (+33 compared to +25 in 10% least deprived areas) and people who describe their health in general as very good or good (+33 compared to +20 amongst people with fair or bad health).
Also the net increase in usage of local parks and open spaces was +38 amongst people who worked from home during the last 4 weeks compared to +22 amongst people who work full or part time but did not work from home during this period.
Transport and distances travelled
Respondents who had taken outdoor visits during the last 4 weeks were asked if, in general, they had used any forms of transport other than walking or cycling to travel to the places they had visited for leisure, recreation or exercise.
During the mid-August to early September 2021 period, 3 in 5 adults (60%) had travelled by car or another mode of motorised transport on their outdoor visits. This was the same level as recorded a year ago in 2020 (59%) but a significantly higher percentage than recorded for the March to May 2020 period when the vast majority of people travelled only on foot when they took visits to the outdoors (73%).
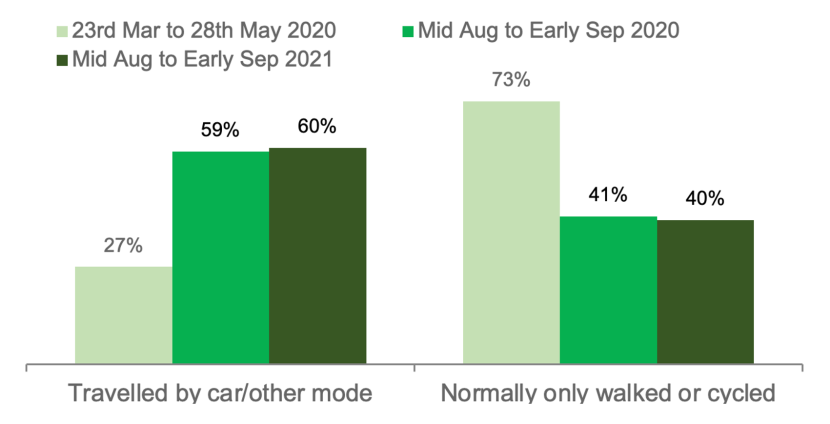
Figure 14: Forms of transport used on visits to outdoors taken for leisure, recreation or exercise during last 4 weeks/ lockdown
Click for a full description
Column chart illustrating the percentage normally only walking or cycling to places visited on outdoor recreation visits and percentage who travel by car or another mode of transport. Results are compared for each of the three survey waves.
Those who travelled by car or another mode of transport were also asked how far these journeys for outdoor recreation or exercise had been.
Whilst in the initial March to May 2020 lockdown period the vast majority of those who had travelled by car stayed relatively local (73% travelled less than 5 miles), longer distances were travelled in mid-August to early September 2020 and in the most recent period during 2021. 71% travelled 6 miles or more during August/September 2021 compared with 65% in the same period in 2020.
| - | March/May 2020 | August/September 2020 | August/September 2021 |
|---|---|---|---|
| Less than 2 miles | 32% | 8% | 8% |
| 2-5 miles | 41% | 27% | 21% |
| 6-10 miles | 18% | 23% | 26% |
| 11-20 miles | 6% | 17% | 18% |
| More than 20 miles | 4% | 25% | 27% |
Party composition
Those who took outdoor visits during this period were also asked about who they had spent this time with. The responses in Figure 15 total to more than 100% as it was possible for respondents to select more than one option, reflecting variations in party composition on different outdoor visits taken.
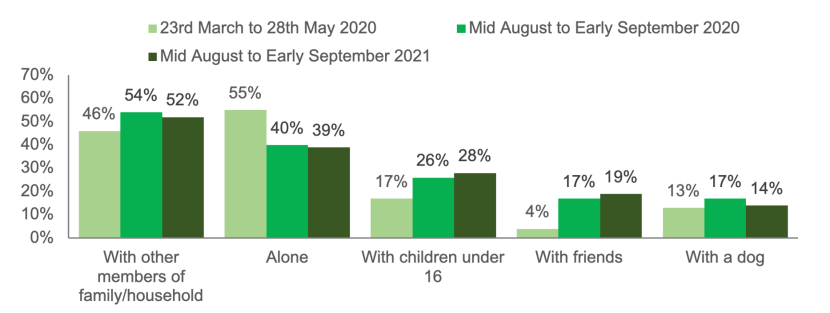
Figure 15: Party composition on outdoor visits taken for leisure, recreation or exercise during last 4 weeks/lockdown
Click for a full description
Column chart illustrating the percentages who have visited outdoors in different groups compositions including with other household members, with children under 16, with friends, with a dog and alone. Results are compared for each of the three survey waves.
During the mid-August to early September 2021 period, just over half of respondents had taken visits with other family or household members (52%), similar to the percentage recorded a year ago but more than recorded during the initial March to May 2020 lockdown period. The percentage taking visits with other family or household members was highest amongst women (57% compared to 47% of men).
39% of people had taken visits to the outdoors alone during this period, which is also similar to the percentage recorded a year before (40%) but less than during March to May 2020 (55%). The percentage taking visits alone was highest amongst men (48% compared to 31% of women).
Overall, 28% had taken visits with children aged under 16. As would be expected this percentage was much higher amongst people who had children at home (72%).
Other engagement with nature
Other than visits to outdoor places, the survey also recorded other types of engagement with nature during the pandemic.
To put this in context, respondents were asked about their access to a garden or other private outdoor space. As shown in Figure 16, results suggest that 71% of the adult population in Scotland had access to their own private garden; in addition, 13% had access to a private communal garden and 5% to another type of private outdoor space such as a balcony or yard. When this question was asked in Waves 1 and 2 of the survey a very similar result was were obtained.
The percentage of people with access to a private garden was significantly lower amongst some population groups, most notably people with no access to a car (46%), members of the ME population (49%), residents of the 10% most deprived areas (54%), people aged under 35 (61%) and residents of large urban areas (68%). Similar differences were seen in all three waves of this survey.
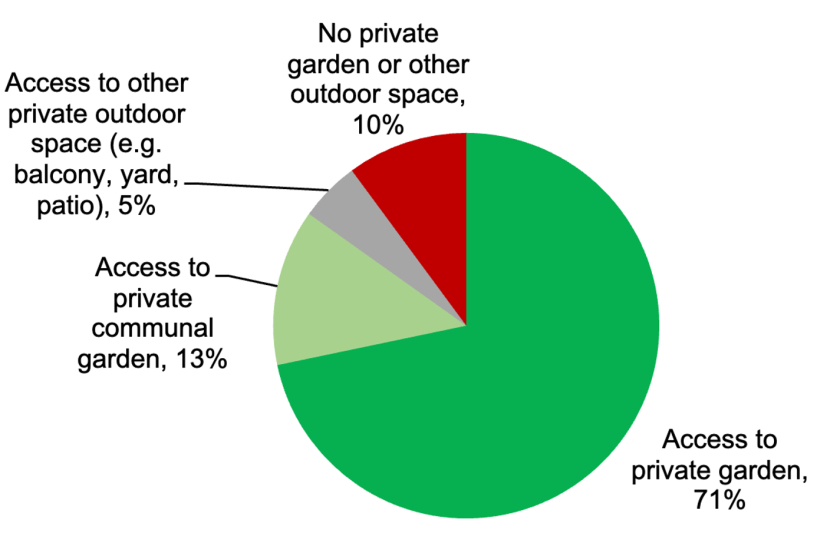
Figure 16: Access to a private garden or other private outdoor space
Click for a full description
Pie chart illustrating percentages of population with access to a private garden or other types of private outdoor space (communal garden, balcony, yard, etc.)
Garden-based activities were undertaken by a large percentage of the population during the pandemic.
Comparing the three survey periods, while sitting and relaxing in the garden or other open space attached to the home remained the most frequently undertaken activity throughout, the percentage of people undertaking this activity was notably higher during the initial lockdown in March to May 2020 than in the subsequent periods.
Reflecting some of the changes described in the previous sections of this report, the percentage of people enjoying nature and wildlife while outdoors away from their home in their local area increased from 36% in March to May 2020 to 47% in August/September 2020 and remained at this level during August/September 2021.
However, participation in gardening, sewing seeds, growing flowers or vegetables decreased during the most recent period.
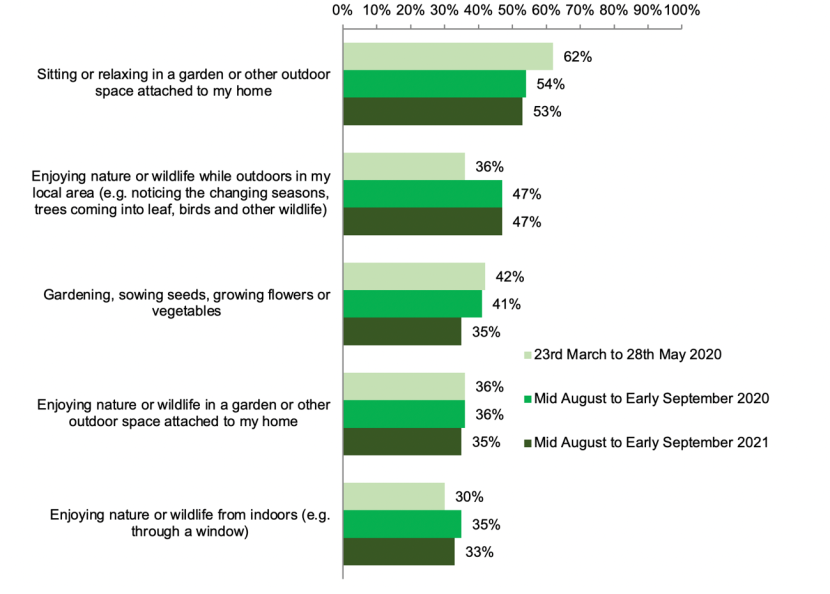
Figure 18: Participation in nature engagement activities during last 4 weeks/lockdown.
Click for a full description
Bar chart illustrating the percentages of population taking part in a range of forms of engagement with nature including activities which can be undertaken in garden and enjoying nature from indoors. Results are compared for each of the three survey waves.
Around 1 in 8 of the population (13%) stated that they had done none of the activities listed in Figure 17. This percentage was higher amongst people with no access to a private garden or outdoor space (35%), people who lived in the 10% most deprived areas (15% compared to 10% in least deprived areas), amongst people with fair or bad health (18% compared to 10% with good or very good health) and amongst people who live in a rented property (18% compared to 10% of those who own their property outright).
Respondents were also asked if the amount of time spent undertaking these activities during this period had changed in comparison to 2019. The net change (i.e. the proportion of respondents stating that they increased the amount of time participating in an activity minus the proportion who decreased the amount of time participating) is shown for each of the three survey periods.
In all three periods, large percentages of respondents indicated that their participation had increased in all of the activities asked about. The greatest increase, in all periods, was recorded for sitting and relaxing in the garden (+34% mid-August to early September 2021 period).
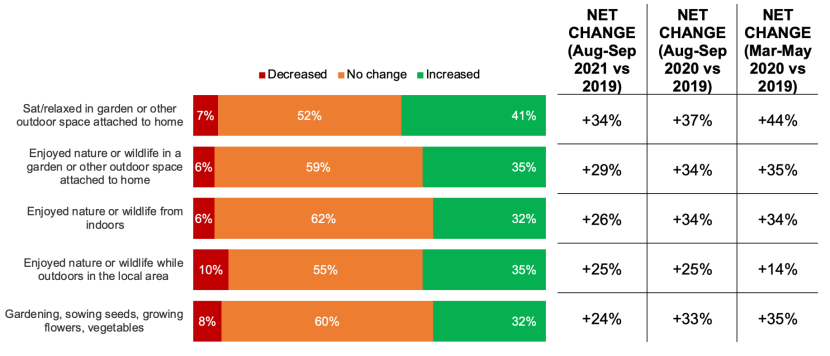
Figure 18: Engagement with nature during last 4 weeks compared to a year ago.
Click for a full description
Stacked chart showing changes in time spent taking part in a range of forms of engagement with nature including activities which can be undertaken in garden and enjoying nature from indoors. Includes a net change for each activity which is compared with the net change recorded in the two previous survey waves.
Benefits of outdoor visits and engagement with nature
A series of questions aimed to explore the motivations behind, and benefits obtained from time spent outdoors and other engagement with nature during the pandemic.
Reasons for taking outdoor visits
Figure 19 shows the reasons people gave for taking outdoor visits during this time. In the mid-August to early September 2021 period, the most frequently selected reasons were enjoying fresh air and pleasant weather, relaxing and unwinding and health and exercise. Other reasons mentioned by more than a third of outdoor visitors included spending time with family/friends, finding peace and quiet, and enjoying scenery and wildlife.
Compared to the same time of year in 2020, during August to September 2021 a decreased percentage of visit takers mentioned health and exercise as a motivation but other reasons were referenced by similar percentages in both periods.
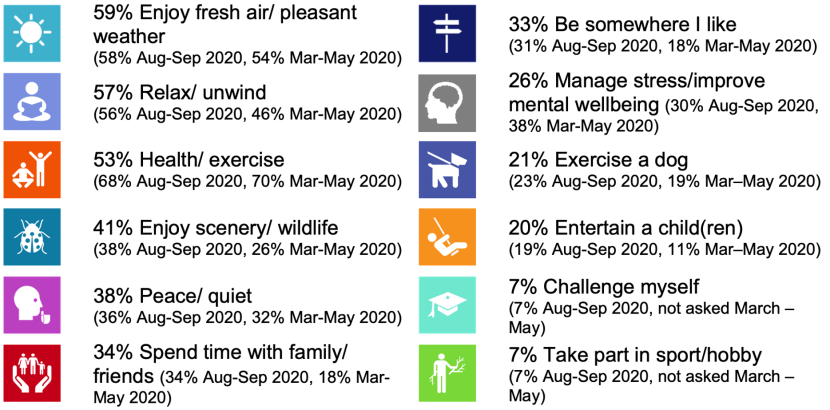
Figure 19: Motivations for visiting the outdoors for leisure, recreation or exercise during last 4 weeks/ lockdown
Click for a full description
Summary of the percentages stating that the visits they have taken were motivated by different reasons. 12 different reasons are shown. Results are compared for each of the three survey waves.
People’s motivations for spending time outdoors in the mid-August to early September 2021 period varied between demographic groups and included the following differences:
- Fresh air and to enjoy pleasant weather – a motivation for 59% overall but higher amongst those aged 65 and over (71%) and residents of the 10% least deprived areas (69% compared to 51% living in 10% most deprived areas).
- To relax and unwind – a motivation for 57% overall but higher amongst people aged 55-64 (66%) and residents of urban areas (64%).
- Health and exercise – a motivation for 53% overall but higher amongst those aged 55 and over (60%), ABC1s (57%), people who own their own home (56%) and residents of the 10% least deprived areas (66%).
- To manage stress/improve mental wellbeing - a motivation for 26% overall but higher amongst women than men (31% vs 21%).
- To spend time with family/ members of my household – a motivation for 34% overall but higher amongst women (39% vs 28% of men)
Benefits of outdoor visits
Respondents were asked to reflect on their outdoor visits and engagement with nature during the pandemic and to indicate the extent to which they agreed or disagreed with a series of statements about their experiences. Answers were provided on a 5-point scale from ‘Disagree Strongly’ to ‘Agree Strongly’.
As shown in Figure 20, during all three survey periods levels of agreement were highest for the statements relating to mental health benefits, with 73% of adults stating that their outdoor visits and engagement with nature during mid-August to early September 2021 had helped them to de-stress, relax and unwind and 66% stating that their visits had made them feel energised and revitalised. Both of these percentages increased from those recorded in the 2020 waves.
Furthermore, during the August to September 2021 period, 3 in 5 people felt closer to nature (61%) and a similar proportion stated that their experiences had improved their physical health (63%). The prevalence of these benefits also increased since 2020.
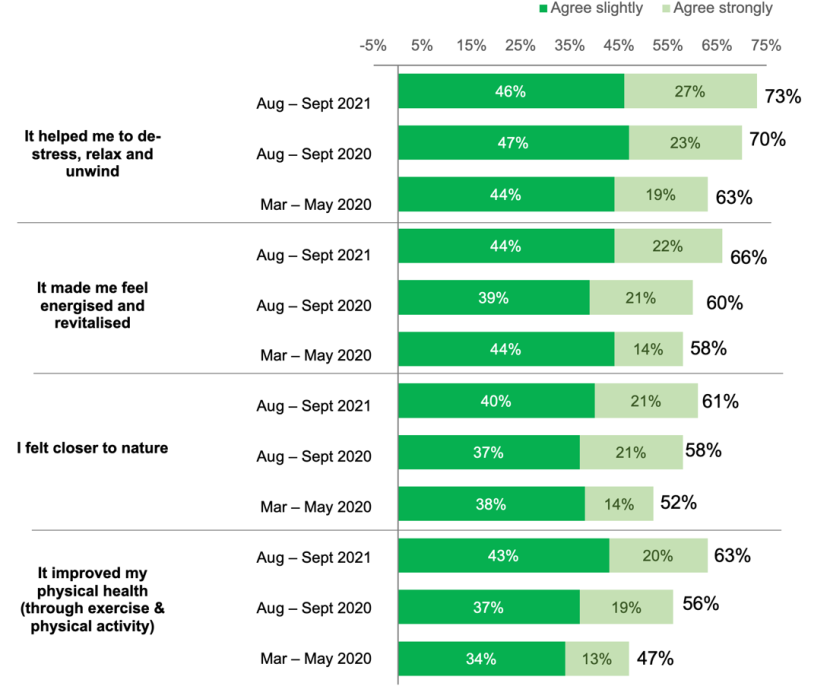
Figure 20: Benefits of outdoor visits and other engagement with nature during last 4 weeks/ lockdown
Click for a full description
Bar chart showing percentages of people agreeing slightly or agreeing strongly with a series of 4 attitude statements relating to the potential health, wellbeing and nature connection benefits of outdoor visits. Results are compared for each of the three survey waves.
It is notable that during Wave 3 of the survey those people who visited the outdoors at least once a week in the last 4 weeks were significantly more likely to agree with any of the statements shown in Figure 20. For example while overall 73% of respondents agreed that outdoor visits and engagement with nature helped them to de-stress, relax and unwind, this increased to 79% amongst those visiting at least once a week (compared to 51% of those visiting less often or never).
Also, those people who stated that they had noticed the health and wellbeing benefits of spending time outdoors getting mentioned more often in the media were also more likely to recognise these benefits from the visits they had taken. Specifically, 86% of those who agreed that they had seen more in the media also agreed that they their own visits had helped them to relax.
To further explore experiences during the pandemic, respondents were shown further statements and asked to what extent they agreed or disagreed with each one in relation to their own experiences since the pandemic began in early 2020. While answers were provided on a 5-point scale from ‘Disagree Strongly’ to ‘Agree Strongly’, Figure 21 shows only the percentages who agreed with each statement.
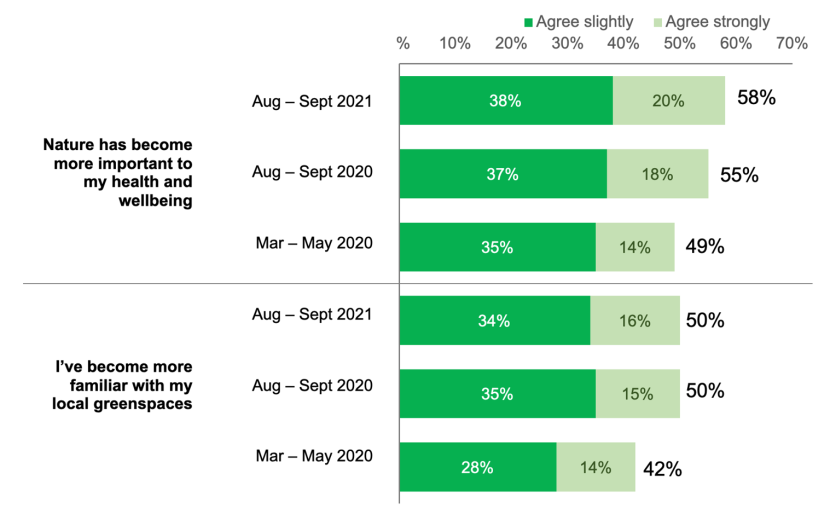
Figure 21: General experiences/ observations since beginning of the pandemic comparisons
Click for a full description
Bar chart showing percentages of people agreeing slightly or agreeing strongly with 2 attitude statements relating to changing importance of nature for health and wellbeing and changing familiarity with local greenspaces since the start of the pandemic. Results are compared for each of the three survey waves.
Reflecting on the period since the pandemic began, almost three in five (58%) agreed that nature had become more important to their health and wellbeing, an increase from 49% in the first survey wave and 55% in the second. Groups more likely to agree with this statement included women (62% compared to 54% of men), people who visited the outdoors at least once a week in the last 4 weeks (64%) and dog owners (66%).
Those people who agreed that they had seen more about the health and wellbeing benefits of spending time outdoors getting mentioned in the media were also more likely to agree that nature had become more important to their own health and wellbeing (74%).
Half of Wave 3 respondents agreed that they had become more familiar with their local greenspaces (50%), an increase from the first wave (42%) and at a similar level to the second. Groups most likely to provide this response included those in the ABC1 socio-economic group (55%), people who visited the outdoors at least once a week in the last 4 weeks (57%) and dog owners (59%).
A number of further statements were added to the survey in Wave 3 as shown in Figure 22 below.
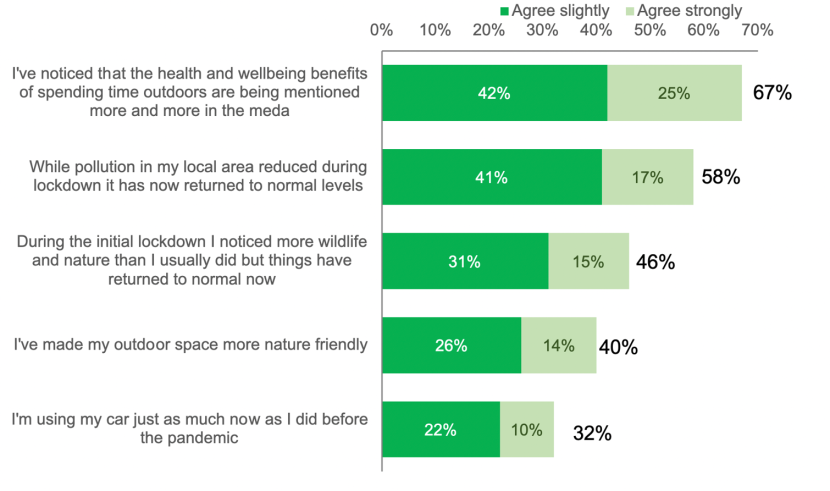
Figure 22: General experiences/ observations since beginning of the pandemic
Click for a full description
Bar chart showing percentages of people agreeing slightly or agreeing strongly with 5 attitude statements relating to experiences during the pandemic. Statements relate to health and wellbeing, pollution, wildlife in local area and car usage. Results are shown for Wave 3
Around two-thirds (67%) agreed that they had noticed the health and wellbeing benefits of spending time outdoors being mentioned more often in the media. Groups most likely to agree with this statement included women (71% compared to 63% of men), ABC1s (70%) and people who visited the outdoors at least once a week (72%).
Over half also agreed with the statement relating to noticing pollution levels returning to normal levels locally after an initial decrease (58%). Again, people who visited the outdoors at least once a week were the most likely to agree with this statement.
Issues experienced by outdoor visitors during lockdown
During the September 2021 survey wave respondents who had visited the outdoors for recreation during the previous 4 weeks were asked whether they had encountered any problems which made their visit less enjoyable. This question was asked in an open-ended format to allow respondents to type in their own experiences without prompting.
Overall, 62% of people who had visited the outdoors in the last four weeks responded with something, a level which was similar across demographic groups. Table 6 details their responses, categorised into groups. Around a quarter (27%) of those who mentioned any problems indicated that litter or similar rubbish/ mess had made their visits less enjoyable while much smaller percentages mentioned other issues.
Notably the second and third most commonly mentioned problems both related to other people. It is notable that although during August/September 2021 fewer restrictions relating to Covid-19 were in place than earlier in the pandemic, 9% commented on people not following Covid related guidance. Most often these comments related to general concerns relating to places being overly crowded, other users not maintaining a comfortable distance and, in a few cases, people not using face coverings.
| - | August/September 2021 |
|---|---|
| Litter/ rubbish/ mess | 27% |
| People not following Covid related guidance (e.g. social distancing) | 9% |
| Anti-social behaviour | 8% |
| Dog fouling | 8% |
| Overcrowding/ too busy | 7% |
| Poor weather | 5% |
| Cyclists (e.g. riding on pavements) | 4% |
| Dogs not under control/ off lead | 4% |
| Problems with wildlife (e.g. insects, wasps, birds) | 2% |
| Lack of parking/ poor parking by others | 2% |
| Traffic | 2% |
| Overflowing bins | 1% |
| No public toilets/ toilets closed | 1% |
| Overgrown paths | 1% |
| Vandalism | 1% |
| Other people’s children | 1% |
| Safety concerns | 1% |
| Facilities not open | 1% |
| Poor access for wheelchair/ buggies | 1% |
People who had taken any visits to the outdoors for leisure, recreation or exercise during the mid-August to early September 2021 period were also asked whether they had experienced any of the issues shown in Figure 23 and if these problems had caused them to change where they went or made them less likely to revisit a particular place. In these questions the potential problems were shown to respondents as a list of answer options.
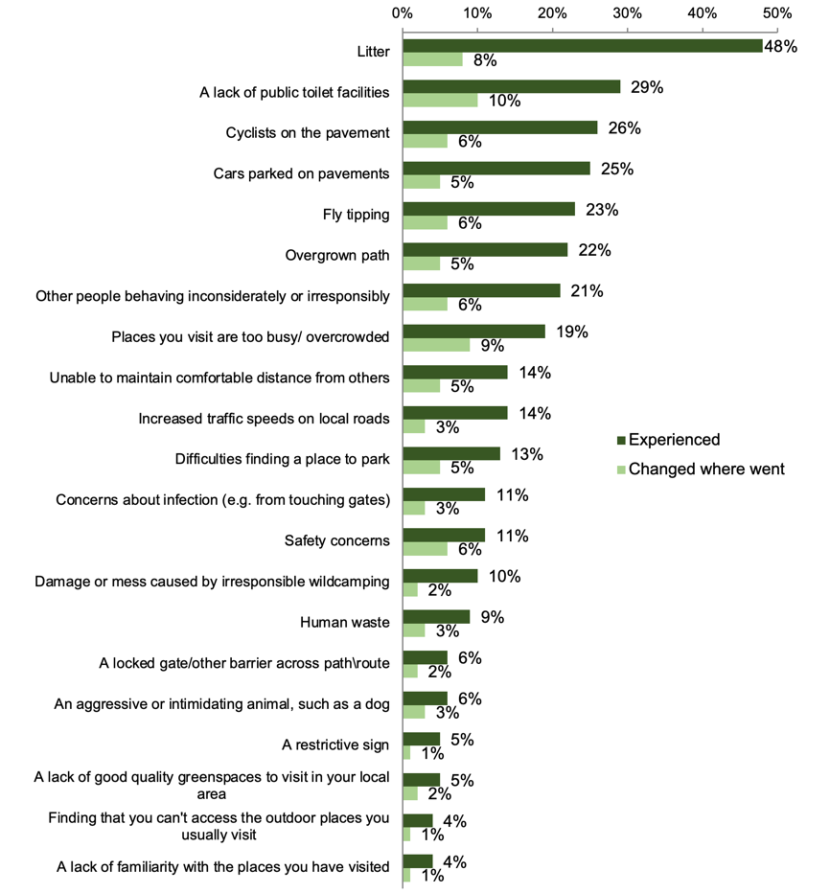
Figure 23: Problems experienced while visiting the outdoors for leisure, recreation or exercise during last 4 weeks.
Click for a full description
Bar chart showing percentages of those people who took outdoor visits in Wave 3 survey who either experienced or made changes to where they went due to a range of potential problems which might be experienced during time spent outdoors. Results relating to 21 potential issues are shown.
Just as with the previous unprompted question, litter came out as the top answer, with almost half of respondents indicating they had experienced it in the last four weeks (48%).
Other commonly experienced issues during this period, each mentioned by a quarter or more of outdoor visitors, were a lack of public toilet facilities (29%), cyclists on pavements (26%) and cars parked on pavements (25%).
The issues most likely to have caused people to change where they went outdoors were a lack of public toilets (10%) and places visited being too busy/ overcrowded (9%).
Figure 24, below, compares how often each problem was encountered during each survey wave between mid-August to early September 2021, the same period in 2020 and during March to May 2020. Notably, the incidence of most of the problems decreased since 2020, in particular concerns around maintaining comfortable distance from others and concerns around Covid infection.
However the percentage of people who had encountered litter increased significantly in the most recent wave from 33% in September 2020 to almost half in the most recent wave (48%).
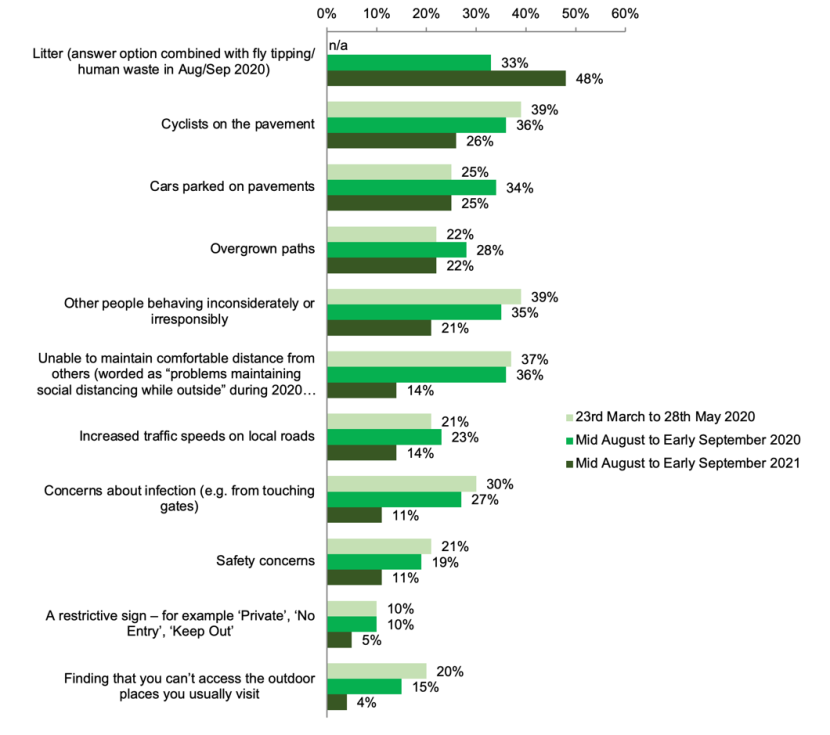
Figure 24: Problems experienced while visiting the outdoors for leisure, recreation or exercise during last 4 weeks/initial lockdown period.
Click for a full description
Bar chart comparing percentages of people who took outdoor visits during each of the three waves of surveying who experienced a range of potential problems. Results relating to 11 potential issues are shown.
Access to quality greenspaces
5% of people who had spent any time outside during mid-August to early September 2021 for leisure, recreation or exercise, had experienced issues relating to a lack of good quality local greenspaces.
To explore this issue further, all respondents were asked to rate the quality of their local greenspaces by stating the extent to which they agreed with statements relating to the accessibility and standard of local greenspaces.
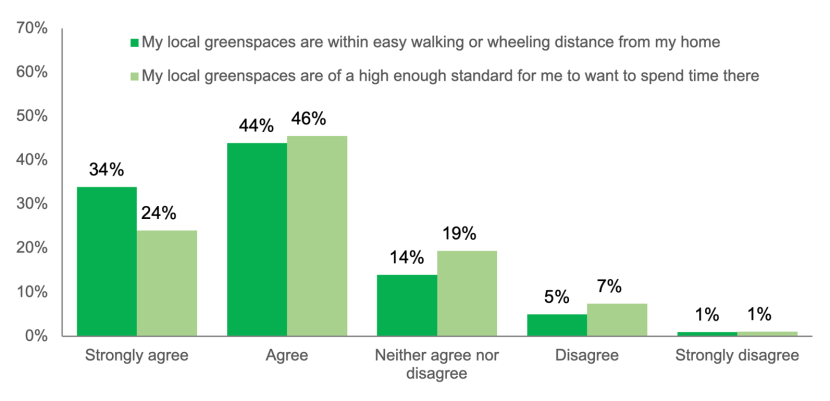
Figure 25: Level agreement with statements relating to local greenspaces.
Click for a full description
Column chart showing levels of agreement with two statements relating to the accessibility and standard of local green spaces. Answer options are on a five point scale and range from Agree strongly to Disagree strongly
While most of the population strongly agreed or agree with both statements, around a fifth neither agreed nor disagreed or disagreed to some extent with the statement relating to places being within easy distance (20%) while over a quarter neither agreed nor disagreed or disagreed to some extent with the statement relating to the attractiveness of their local places (27%).
During Waves 1 and 2 of the survey respondents were asked to what extent they agreed with the following single statement which related to both the accessibility and standard of local greenspaces “My local greenspaces are within easy walking distance and of a high enough standard for me to want to spend time there.” With this combined statement covering both areas, responses were very similar to those obtained in Wave 3 in relation to accessibility with 34% agreeing strongly, 43% agreeing, 15% neither agreeing not disagreeing and 8% disagreeing or disagreeing strongly.
By ‘splitting’ this into two separate statements relating to access and standard separately it has been possible to obtain a more granular view on the opinions of respondents.
As shown in Figure 26, the percentage of people who agreed slightly or strongly with one or both statements was lower amongst people with poor health, people with a limiting illness or disability, people who were members of the ME community and people who rented their home.
Also there is a direct correlation between frequency of visits to the outdoors and levels of agreement with each of the statements.
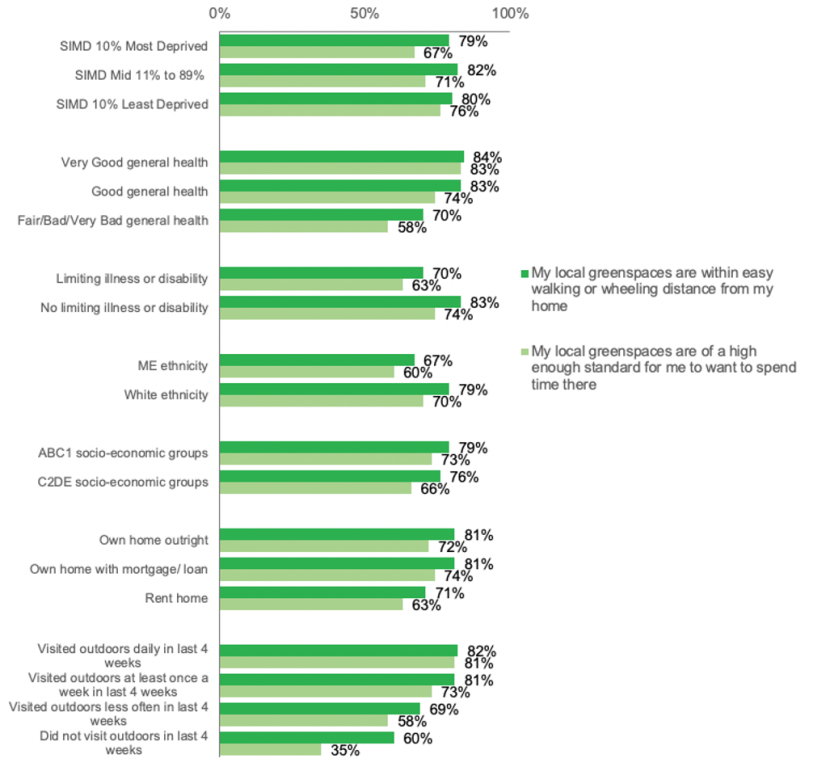
Figure 26: Level of agreement with statements relating to local greenspaces by demographics
Click for a full description
Bar chart showing overall levels of agreement with two statements relating to the accessibility and standard of local green spaces amongst a range of demographic groups (SIMD, health status, disability, ethnicity, socio-economic group, housing tenure, frequency of visits to outdoors).
Looking to the future
A series of questions were asked to obtain an indication of potential changes in people’s behaviours and attitudes regarding outdoor visits and engagement with nature in the future.
As shown in Figure 27, during the most recent survey wave, 43% stated that in future they expected to visit the outdoors for leisure recreation and exercise about the same amount as before the start of the pandemic. This percentage has increased from the levels recorded in both of the 2020 waves.
In the most recent wave 48% stated that they expected to visit the outdoors more often in future than before the first lockdown. This percentage is similar to that recorded during both of the previous waves although it is notable that an increased share indicate that they are a ‘a lot more’ likely to do so,
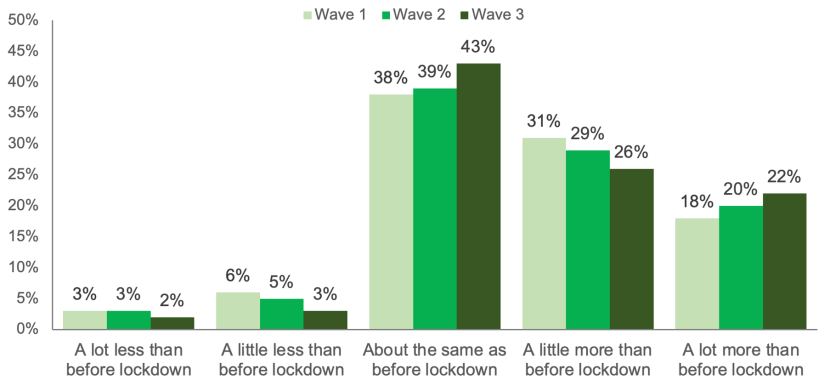
Figure 27: Extent that people expect the amount they visit the outdoors for leisure, recreation or exercise to change in future
Click for a full description
Bar chart showing amount of time people expect to spend outdoors in future compared to their normal patterns before the pandemic. Answer options include A lot less, A little less, About the same, A little more and A lot more. Results are shown for all three survey waves.
As shown in Figure 28, the amount of time people expected to spend on outdoor visits in future varied between population groups.
The groups most likely to state that they expected to visit the outdoors more often in future included women (50%), those aged under 35 (56%), members of the ME population (62%), dog owners (54%) and those with very good health (55%).
The people most likely to state that they didn’t expect to see any change in the amount they visited the outdoors included men and people aged 70 or over.
While similar results were obtained for most of these population groups when this question was asked in Waves 1 and 2, it is notable that levels of interest in increasing time spent outdoors increased amongst the ME population from 48% in September 2020 to 62% in September 2021.
It is also notable that during Wave 3, 64% of people who expect to work from home more often in future than they did before the pandemic also expected to increase their time spent outdoors the future, a significantly higher percentage than amongst people who currently work but do not expect to work from home in the future (45%).
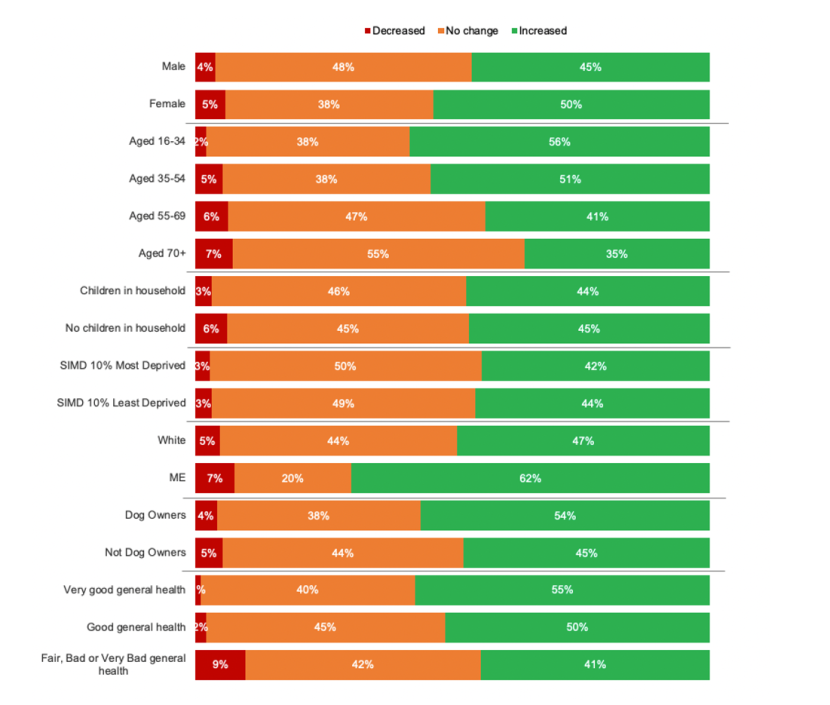
Figure 28: The extent people expect the amount they visit outdoors for leisure, recreation or exercise will change in future by population group
Click for a full description
Stacked bar chart showing amount of time people expect to spend outdoors in future compared to their normal patterns before the pandemic by key demographic groups. Results are summarised to show percentages expecting to Spend less time, No change in time or More time. Results are shown by gender, age group, children in household, SIMD, ethnicity, dog ownership and health status.
To understand further potential changes in behaviours and attitudes into the future, respondents were shown a series of statements and asked to what extent they agreed or disagreed with each.
While answers were provided on a 5 point scale from ‘Disagree Strongly’ to ‘Agree Strongly’, Figure 29 shows only the percentages of respondents who agreed with each statement during each survey wave, excluding those respondents who said that the statement was not relevant to them (for example, because they had no children).
Similar to previous waves the largest proportion of respondents agreed with the statement relating to encouraging children to spend more time outdoors (68%) while a smaller percentage agreed with the statement relating to doing more to look after local nature (52%).
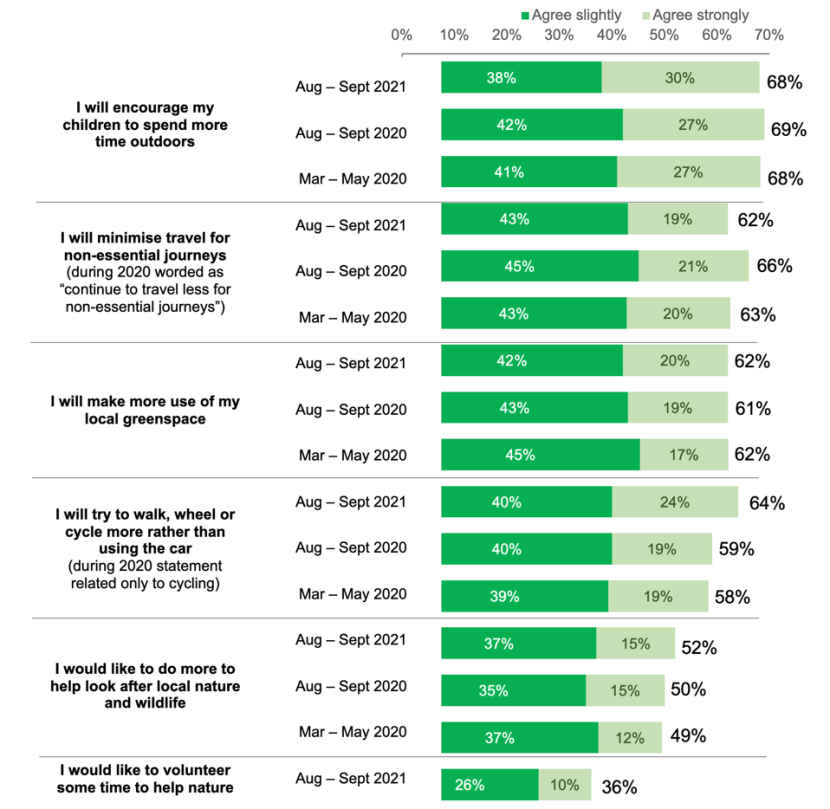
Figure 29: General experiences/ aspirations for the future
Click for a full description
Bar chart showing percentages of people agreeing slightly or agreeing strongly with a series of 6 attitude statements relating to expectations for the future in relation to spending time outdoors and pro-environmental behaviours. Results are compared for each of the three survey waves.
There were some variations in levels of agreement with each statement amongst different population groups, including the following during the September 2021 wave:
- Will encourage my children to spend more time outdoors – while 68% agreed overall, levels of agreement were higher amongst women (74% compared to 61% of men).
- Will minimise travel for non-essential journeys - 62% agreed overall with levels of agreement higher amongst women (66% compared to 58% of men).
- Will make more use of local greenspace - 62% agreed overall with levels of agreement higher amongst women (66%), people aged 16-24 (72%) and ABC1s (66%).
- Will try to walk, wheel or cycle more rather than using the car - 64% agreed overall, increasing to 66% amongst residents of urban areas compared to 59% amongst rural residents.
- Would like to do more to look after local nature and wildlife - 52% agreed overall, with levels of agreement higher amongst women (56% compared to 48% of women) and people aged under 45 (60%).
- Would like to volunteer some time to help nature – 36% agreed overall increasing to 58% amongst people aged 16-24 and 44% amongst those aged 25 to 44. Also higher amongst ABC1s (39%) and dog owners (42%).
Impacts on personal finances and working patterns
An additional series of questions was included in the September 2021 survey to explore the impacts of the Covid-19 pandemic on personal finances and working patterns and the possible implications of these impacts on participation in outdoor recreation.
Impacts of crisis on finances
As shown in Figure 30 around a third of the adult population agreed to or strongly agreed that their personal finances had been negatively impacted by the Covid-19 crisis.
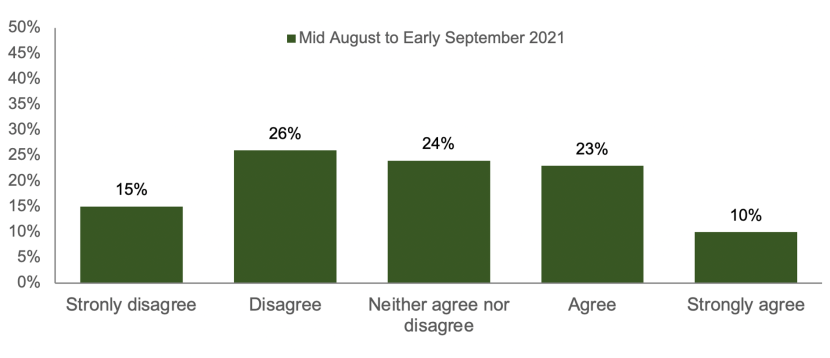
Figure 30: Level of agreement with statement “My personal/ household finances have been negatively impacted by the Covid-19 crisis.”
Click for a full description
Bar chart showing percentages in Wave 3 strongly agreeing, Agreeing, Neither agreeing nor disagreeing, Disagreeing or Strongly disagreeing with statement relating to the impacts of Covid-19 on personal finances.
Levels of agreement with this statement varied by demographic group (Table 7), highest amongst women, people aged 16-34, people with children at home, members of the ME community and residents of the 10% most deprived SIMD areas.
In relation to outdoor recreation, 34% of people who normally visited the outdoors at least once a week in the last 4 weeks agreed that their finances had been impacted by the crisis compared with just 20% of those who never took any visits.
| - | Disagree | Neither agree/ disagree | Agree |
|---|---|---|---|
| Male | 47% | 23% | 29% |
| Female | 36% | 25% | 36% |
| 16-34 | 28% | 25% | 44% |
| 35-54 | 37% | 23% | 37% |
| 55+ | 54% | 24% | 20% |
| White | 42% | 24% | 32% |
| Minority ethnic | 21% | 27% | 46% |
| SIMD 10% most deprived | 35% | 27% | 33% |
| SIMD 10% least deprived | 59% | 19% | 22% |
| Children in household | 35% | 25% | 38% |
| No children in household | 45% | 24% | 29% |
| Visit outdoors at least once a week | 41% | 23% | 34% |
| Visit outdoors less often | 37% | 27% | 30% |
| Never visit outdoors | 48% | 27% | 20% |
Working from home
The September 2021 survey sample represented the adult population in Scotland with almost three in five respondents (57%) working full or part time or self-employed. None of those surveyed were still on Furlough leave (the scheme ran until the end of September 2021).
| - | Aug-Sep 2021 |
|---|---|
| Working full time (30+ hours per week | 40% |
| Working part time (8-29 hours per week) | 13% |
| Working part time (<8 hours per week) | 1% |
| Self employed | 3% |
| Full or part time student | 4% |
| Retired | 22% |
| Unemployed | 9% |
| Currently on Furlough leave | 0% |
| Other | 8% |
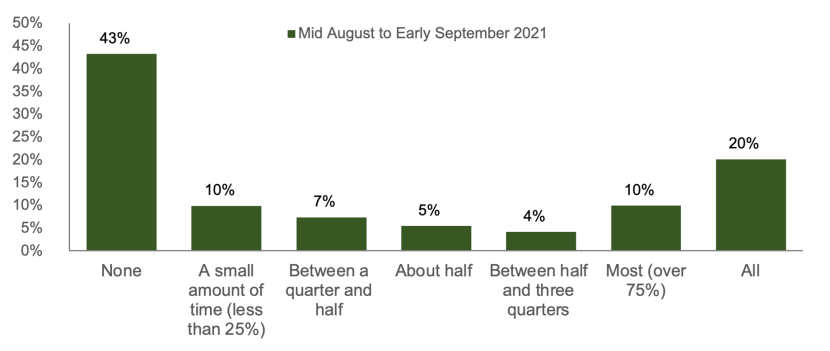
Figure 31: Proportion of time working during last 4 weeks which was spent working from home.
Click for a full description
Bar chart showing percentages of working people surveyed during Wave 3 working from home during last 4 weeks for different percentages of their time spent working (ranging from none to all).
Respondents in full time or part time employment or self-employed were asked whether they had spent any time during the last 4 weeks working from home. As shown in Figure 31, 57% had spent at least some of their time working at home. Overall, around a third (39%) spent about half or more of their working time, working from home.
People most likely to state that they spent about half or more of their time working from home included those in the ABC1 socio-economic groups (47% compared to 26% of C2DEs) and people who work full time (42% compared to 28% working part time).
Amongst those who spent any time working from home during the last 4 weeks, 67% stated that they were working from home more often than before the pandemic (54% a lot more and 13% a little more). 23% stated that there was no change in the amount that they worked from home compared to before the pandemic while 8% were working from home less often.
28% of those who had worked from home during the last 4 weeks thought that doing so had any effect on the amount of time they spent outdoors for leisure, recreation or exercise or the types of activities they do.
In around two thirds of these cases respondents were visiting the outdoors more often, benefitting from increased time to do leisure due to a reduction in time commuting, enjoying being able to take a lunch time walk and/or being able to spend more time in their garden.
Some specific comments provided included the following:
“It’s been good for my health and quality family time being able to leave work and get on with your personal time with no commute is amazing.”
“If it’s a nice day I take laptop outside and work.”
“I am able to go for walks /jogs during the time I would otherwise spend commuting, or during lunch breaks.”
“Time not needed for commute, lunchtimes etc. means more time to get outside, more emphasis on wellbeing so more eager to get out as much as I can to escape the house.”
“I'm able to utilise my time outdoors a lot more and still get my work life duties completed.”
“Positive effect. Much better work life balance and can find more time to do things like this.”
However, around a third of those who stated that working from home had changed their outdoor recreation habits indicated that they were now participating less often.
The most common reasons given by these respondents were a decreased amount of time spent walking or cycling to work, not having the ability to take a lunch time walk from the office and in general becoming too busy to take breaks.
Looking to the future 38% of people who work full or part time stated that they expected to work from home more often in the future that they did before the pandemic. Almost a quarter (23%) expect to work from home ‘a lot’ more. This proportion increased to 29% amongst ABC1s and 28% amongst those working full time.
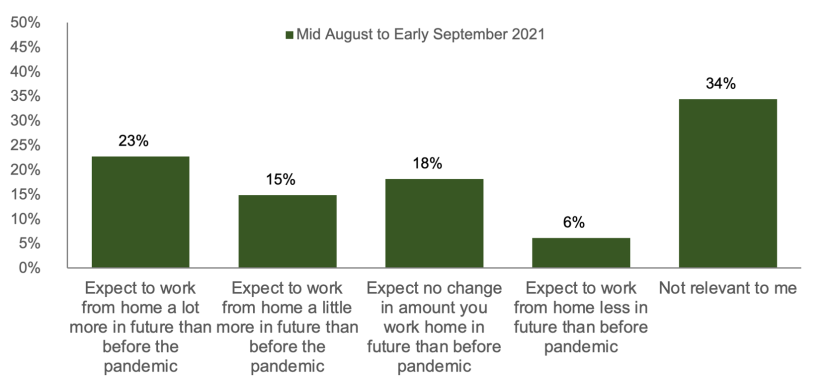
Figure 32: Expectations for working patterns in future compared to before the pandemic
Click for a full description
Bar chart showing amount of time people surveyed during Wave 3 expect to work from home in future in comparison to before the pandemic. Responses ranging from expect to work from home less often to expect to work from home a lot more often.
Furlough leave
While no respondents were currently on Furlough leave at the time of the survey (the Government Furlough scheme was available from March 2020 to the end of September 2021) 13% had been at some point during the pandemic. This proportion increased to 21% amongst people aged 16 to 34 and 23% amongst people who work part time for between 8 and 29 hours per week.
28% of those who had been on Furlough leave indicated that this had any effect on the amount of time they spent outdoors for leisure, recreation or exercise or the types of activities they did. Around four fifths of these respondents stated that they had spent more time outdoors, largely due to an increased amount of free time due to not working.
Some of the responses provided were as follows:
“I had more time to spend outdoor without worrying about work or money.”
“Spent a lot more time outdoors as I was not working - it allowed me to keep busy get outside and look after my wellbeing.”
“Was able to spend time in the garden instead of working all the time.”
“I spent more time in the garden and going walks when I was furloughed, to kill time.”