NatureScot Research Report 1279 - Analysis of Basking Shark Watch Database 1987 to 2020
Year of publication: 2024
Authors: Pikesley, S.K. (University of Exeter), Carruthers, M. (NatureScot), Hawkes, L.A (University of Exeter) and Witt, M.J. (University of Exeter)
Cite as: Pikesley, S.K., Carruthers, M., Hawkes, L.A. and Witt, M.J. 2024. Analysis of Basking Shark Watch Database 1987 to 2020. NatureScot Research Report 1279.
Keywords
basking sharks; public sightings data; database validation; spatial and temporal patterns
Background
Basking Shark Watch (BSW) is a public sightings scheme that has operated since 1987 and has been managed by both the Marine Conservation Society and the Shark Trust. The scheme was initiated primarily to provide an indication of the seasonality and distribution of basking shark surface sightings in UK coastal waters. Over the past 33 years (1987 to 2020) the database has recorded 17,697 surface sightings of basking sharks.
The aim of this project was to provide an updated analysis of the dataset to help improve data accessibility and utility. This report describes BSW database fields and checks geographic coordinates of sightings for likely spatial accuracy. Spatial validation confidence scores are assigned, and possible duplicated sightings of sharks are identified. Spatial and temporal patterns for the Sea of the Hebrides Marine Protected Area, Scotland and wider geographical limits are described and discussed. Recommendations are made for ongoing data collection, management and use of BSW data.
Main findings
- The BSW public sightings database represents a vast repository for surface sightings of basking sharks, primarily in UK coastal waters, gathered over more than three decades.
- Following spatial validation checks and removal of potential duplicate sightings a total of 12,878 basking shark records were available to use in spatial and temporal analyses.
- Surface sightings of basking sharks remained fairly constant from 1987 to 2003. Peak years for sightings were 2004 to 2013. Since 2014 sightings have notably decreased.
- Peak sightings months were May through to September, with some evidence of sightings being recorded earlier in the season in the south of the UK.
- The duration of the sighting season in each year across the UK remained relatively stable, however, from 2014 onwards the sighting season appeared to have broadened slightly. This may relate to the significant reduction in sightings over the same period, so should be interpreted with caution.
- Three distinct regions were identified where surface sightings were at their greatest: western Scotland (including the Sea of the Hebrides MPA), the Isle of Man and southwest England.
- The drivers behind the apparent decline in basking shark sightings are difficult to quantify. It may indicate a decline in species, but could also be indicative of a decline in public reporting of sightings.
- Consistency in promotion of the scheme and ease of reporting for public could be crucial to ongoing management of the database.
Acknowledgements
With thanks to the Marine Conservation Society and the Shark Trust who provided the Basking Shark Watch database analysed in this report, along with the organisations and numerous citizen scientists who have contributed sightings to the database in over three decades of data collection.
Introduction
Basking Shark Watch (BSW) is a public sightings database, managed originally by the Marine Conservation Society (MCS) and, since July 2016, by the Shark Trust. The MCS basking shark sightings database was initiated in 1987 to provide an indication of the seasonality and distribution of sightings in UK coastal waters (Southall et al., 2006; Witt et al., 2012). The database was initially compiled from sightings submitted by telephone, post or email which were recorded using dedicated sightings cards. These data were then transcribed into an electronic database. An online sightings portal was introduced in 2001 and the facility to report sightings via sightings cards was discontinued in 2007.
BSW data were used as background context to support the advice given by NatureScot on the case for designation of the Sea of the Hebrides Marine Protected Area (MPA), which includes basking sharks as a protected feature. With the designation announcement in 2020, monitoring and management of basking sharks within the site is being developed and coordinated through ongoing discussions.
The aim of this project is to provide an updated analysis of the dataset, improve data accessibility and make recommendations for ongoing collection of the data. It is hoped this will feed into ongoing and future use of BSW data in discussions around basking shark conservation and management.
The analysis presented here audits and describes BSW database fields. Geographic coordinates of public sightings were checked for likely spatial accuracy, and assigned confidence scores, and probable duplicate sightings of sharks were flagged. Spatial and temporal patterns for the Sea of the Hebrides MPA, Scotland and wider British Isles are described and discussed. Recommendations are made for ongoing data collection, management and use of BSW data.
Methods
Database audits and metadata
Public sightings data were sourced from the Marine Conservation Society (1987 to 2016) and the Shark Trust (2016 to 2020). Databases were examined and data fields audited for content and completeness, and metadata for each data field were compiled. The two separate databases were then merged in to a master database. To facilitate this, the Shark Trust (ST) database was appended to the Marine Conservation Society (MCS) database and fields aligned as detailed in Table 1.
The ST database fields ‘Confidence’, ‘Status’ and ‘Ocean’ were added to the merged databases as no corresponding fields were present in the MCS database. ST database entries (for the period 17/02/2016 to 27/10/2020) which had already been recorded in the MCS database were identified and reduced to unique entries. Duplicate entries in the database were identified when recorded ‘location’ / ‘localname’, sightings date and geographic coordinates were the same in the combined database but were identified by independent record numbers. An additional field was added to identify year of sighting and the database source: ‘MCS’ or ‘ST’.
Four entries in the merged database had no spatial reference (no recorded latitude or longitude). These entries were flagged in the ‘DecLatitude’ and ‘DecLongitude’ fields as NSR (No Spatial Reference) and were removed from subsequent data validation. Data were sorted by sightings date.
Table 1. Merge of the Marine Conservation Society and Shark Trust basking shark sightings databases, revealing field alignment. The Shark Trust database fields ‘Confidence’, ‘Status’ and ‘Ocean’ were appended to merged dataset as additional fields as no corresponding fields were present in the MCS database.
|
Shark Trust Database Field |
Marine Conservation Society Database Field |
|---|---|
|
A: (id) |
A: (No) |
|
B: (species) |
BW. (Species) |
|
C: (quantity) |
BP: (Total Number of Sharks) |
|
D: (status) |
New field added [blank values appended] |
|
E: (localename) |
N: (Location) |
|
F: (ocean) |
New field added [blank values appended] |
|
G: (confidence) |
New field added [blank values appended] |
|
H: (where) |
S: (Other) |
|
I: (sightingsconditions) |
AR to AU. Binary columns (TRUE/FALSE) sea conditions (Calm, Rough, Moderate) at time of sighting |
|
J: (sightingdate) |
H: (Date of Sighting) |
|
K: (sightinglat) |
Y to AC: Geographic coordinate of sighting expressed as Latitude |
|
L: (sightinglon) |
AE to AI: Geographic coordinate of sighting expressed as Longitude |
|
M: (DecLatitude) |
AD: (DecLatitude) |
|
N: (DecLongitude) |
AJ: (DecLongitude) |
|
O: (Year of Sighting) |
BY: (Year of Sighting) |
Spatially validating data
To identify if sightings were georeferenced on land or at sea, data were viewed in ArcMap (ArcMap 10.8.1: ESRI, Redlands, USA) and a binary score added to the combined basking shark database to identify if sightings were on land (TRUE/FALSE). Where a sighting was at sea, the Exclusive Economic Zone (EEZ) 3-digit ISO identifier, and EEZ country were assigned as additional fields to the record. For each sighting, the distance (km) from UK and Irish coastline (MHW derived from GSHHG (Global Self-consistent, Hierarchical, High-resolution Geography Database) data was calculated. If the sighting was on land the distance was given a negative sign. These data were added to the combined database as ‘Distance from UK/IRL coastline’.
In previous projects using MCS data it was identified that the geographic coordinates of sightings could sometimes differ from other spatial metadata (e.g. location name). To investigate the spatial validity of sightings records the coordinates of sightings and associated spatial metadata (e.g. description of nearest town, location, county of sighting) were compared to a georeferenced place name gazetteer, compiled from the following data:
• OS National Place Names Gazetteer (UK)
• OSi National Place Names Gazetteer (Ireland)
• OSNi National Place Names Gazetteer (Northern Ireland)
• Isles of Man Place Names Gazetteer
Approximate String Matching (Fuzzy Matching) was used to determine the spatially closest fuzzy matched place name to that reported as ‘nearest town’ or ‘location’ at the time of sighting in the associated metadata. Fuzzy matching allows identification of non-exact matches (including typographical errors and partial string matches) between a search term (in this instance place name gazetteer) and target text string (nearest town or description of location). A preliminary fuzzy match between the place name gazetteer and ‘nearest town’ with an arbitrary threshold of 200 km revealed that a threshold of 50 km enabled the identification of over 97% (97.3%) matches between spatial descriptions of the sighting location and the associated geographic coordinates supplied for the sighting (Figure 1).
To optimise matching, place names geographically located closest to the reported location were searched first. For each recorded sighting, distance (km) (to a maximum distance of 50 km), was calculated for each place name in the gazetteer (R Development Core Team 2019; R package: geosphere (Hijmans et al., 2017)). Data were sorted from minimum to maximum (distance) and if a match was found the latitude, longitude and distance of gazetteer place name from reported place name were recorded. Where no matches were found data were further Fuzzy Matched to determine the spatially closest ‘County’ to that reported as ‘Sighting County’ at the time of sighting. For the purpose of analysis, the match at county level included UK, Scottish and British Crown dependent islands (e.g. Isle of Wight, Isles of Scilly, Isle of Man, Shetland Islands, Isle of Mull, Jersey etc.). Data were then assigned an alphanumeric classification (Table 2) to describe their spatial validation confidence level: 1, 2, 3 or U1. A preliminary classification of data highlighted 1,620 records classified as class 3 (i.e. no match identified within 50 km). These data were manually investigated further. Where a sighting was spatially referenced greater than 50 km from UK / Irish coastline and metadata were recorded that described the sighting as ‘offshore’ and/or from a vessel these data were given the classification of U2 (n = 93). These classifications were appended to the combined database as ‘spatial validation’. See Annex 1 for examples of combined database fields.
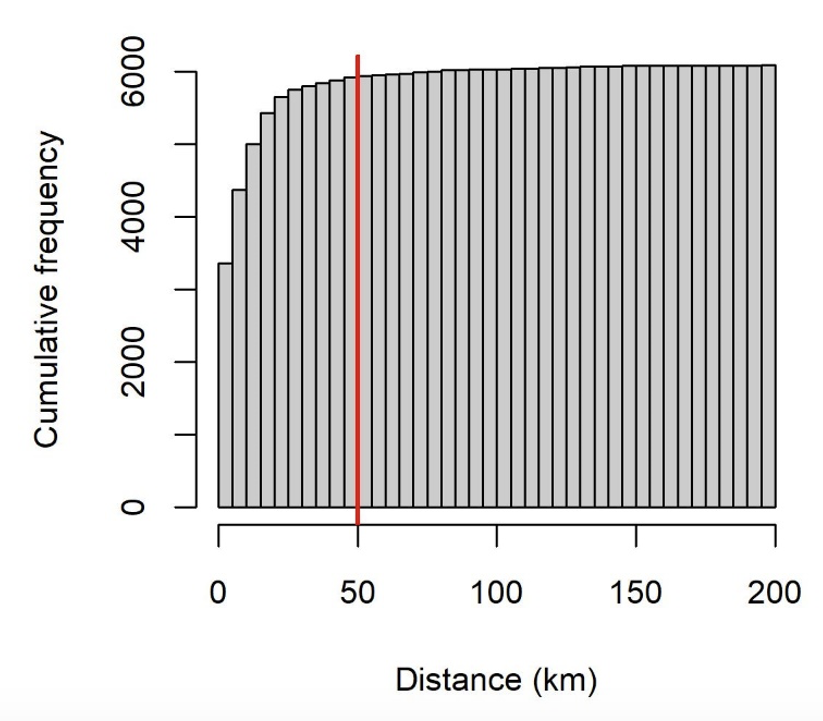
The cumulative frequency of sightings is given on the y axis, with distance in km from the place name in the gazetteer marked along the x axis. The cumulative frequency curve approaches a horizontal asymptote at a maximum distance of 50 km (shown by a red line), this threshold enabled the identification of over 97% matches.
Table 2. Spatial validation confidence classifications described by match type and total number (n) of database entries matched.
|
Spatial validation confidence classification |
Match type |
Data entries matched (n) |
Percentage of all records |
|---|---|---|---|
|
1 |
Match found within a maximum distance of 50 km for ‘nearest town’ or description of sighting location. |
9,112 |
52% |
|
2 |
Match found within a maximum distance of 50 km for County. |
5,346 |
30% |
|
3 |
No matches found within 50 km of recorded sighting. Possible reasons include:
|
1,527 |
9% |
|
U1 (unclassified 1) |
No metadata recorded in database for ‘nearest town’, description of sighting location or county, as such no match was possible. |
1,619 |
9% |
|
U2 (unclassified 2) |
Sighting spatially referenced greater than 50 km from UK / Irish coastline, as such no spatial validation was possible. However, metadata recorded in database described the sighting as occurring ‘offshore’ and/or from a vessel. |
93 |
1% |
Identifying potential duplicated sightings
To investigate possible duplication of sightings (repeat sightings of the same shark or duplicated entries on the same day within the combined database) data were analysed in R (R Core Team 2021) using spatially constrained hierarchical clustering. Spatially constrained clustering algorithms work by grouping sets of data points into subsets or clusters, defined by a given distance threshold. Daily data were extracted, and a geodesic distance (metres) matrix calculated among all sighting locations for that day. Clusters were then determined using a 1 km distance threshold. We chose a conservative distance threshold to facilitate the differentiation of duplicated records (repeated observation of a single animal at a fixed location), from repeat sightings (multiple observations of same shark on the same day but allowing for movement of the animal). The first location within the cluster was identified and all subsequent locations marked as duplicates. An additional binary field (TRUE/FALSE) was added to the combined basking shark database to identify unique (non-duplicated) sightings.
Investigating temporal/spatial patterns and trends
To explore temporal/spatial patterns and trends, data were selected between latitudes 49°N and 61°N, and longitude 5°E and 12°W. Sightings with spatial validation confidence class 3 (see Methods 2.2, Table 2) were first removed. Duplicated sightings (repeat sightings of the same shark or duplicated entries on the same day) were then identified (see Methods 2.3) and excluded. To investigate patterns and trends within regional areas data were apportioned by the Sea of the Hebrides, Scottish waters (excluding the Sea of the Hebrides), and English/Irish waters (Figure 2). To examine data at a finer spatial scale data were further apportioned by 2-degree latitudinal band (Figure 2).
To calculate spatially explicit basking shark densities (sightings/km2) for UK and Irish coastal waters, filtered sightings records were apportioned by five time periods: (a) 1987 to 1992 (6 years), (b) 1993 to 1999 (7 years), (c) 2000 to 2006 (7 years), (d) 2007 to 2013 (7 years) and (e) 2014 to 2020 (7 years). These data were then summed using a 50 x 50 km polygon sampling grid and expressed as densityonce correcting for coincident sea area.
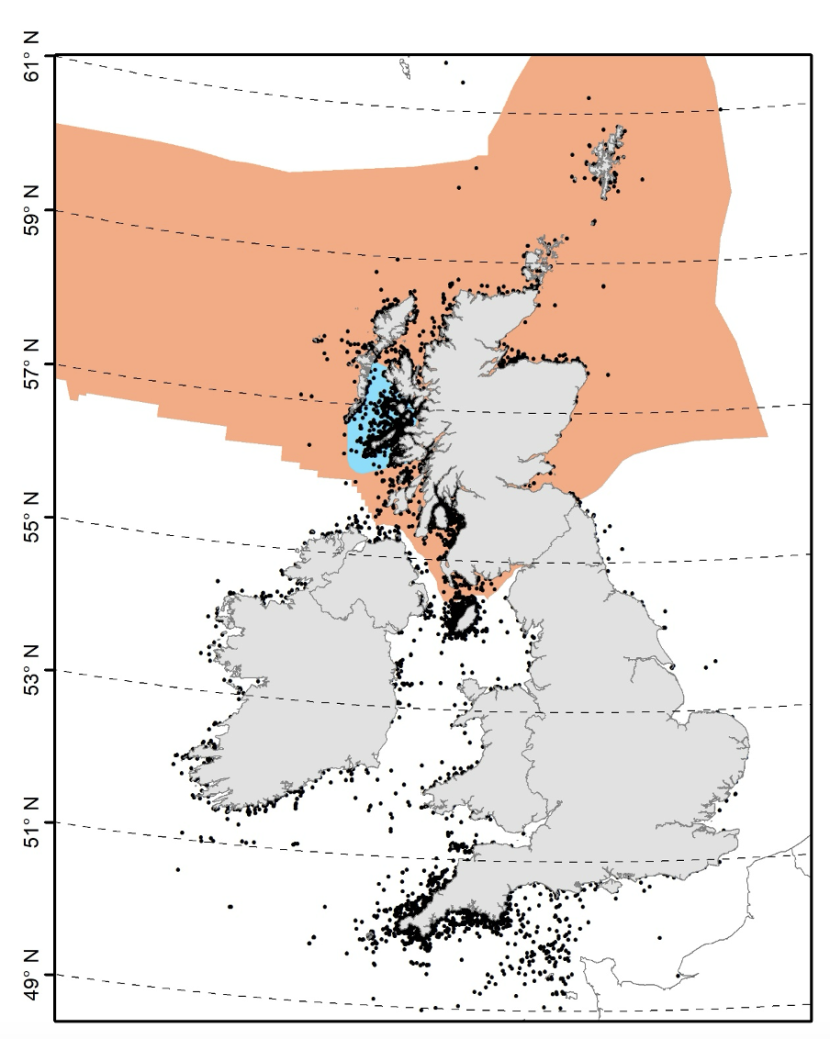
Analysed data (black filled circles: n = 12,878) comprising filtered basking shark surface sighting records spatially referenced between latitudes 49°N and 61°N, and longitude 5°E and 12°W with confidence classifications 1, 2, U1 and U2. Spatially explicit boundaries used to apportion data for the Sea of the Hebrides MPA (light blue polygon) and Scottish waters (orange polygon). 2-degree latitudinal banding used to apportion data shown as black broken grid lines. Maps drawn to Projected Coordinate System: British National Grid Transverse Mercator. Contains OS data © Crown copyright and database rights (2023).
Results
Database audit and metadata
Marine Conservation Society database 01/04/1987 to 22/10/2016
Data comprised 17,495 entries (rows) with 78 fields:
- A: (No). Marine Conservation Society (MCS) unique record number.
- B: (Year). Data are complete but inconsistent being comprised of entries that describe the year in which the sighting was reported to MCS (where recorded – see C below) or year in which the sighting was observed.
- C: (Date of Report). Data are incomplete, 14,717 records, 2,778 blanks. 4 records contained obvious date errors (i.e.):
- No 4271: date of report 14/12/2020, date of sighting 11/07/2002
- No 4305: date of report 14/12/2020, date of sighting 15/07/2002
- No 5001: date of report 14/02/2094, date of sighting 14/02/2004
- No 7141: date of report 09/09/2020, date of sighting 09/09/2005
- D, E, F: binary columns (TRUE/FALSE) to describe data received by: ‘Report card’, ‘Email’ or ‘Telephone’, but data are incomplete. Received by report card / email (12,009 binary [TRUE/FALSE] records, 5,486 blanks), received by telephone (12,138 binary records, 5,357 blanks).
- G: (Source of Survey). Data are incomplete (11,868 records, 5,627 blanks). The 11,865 rows of data contain 534 unique entries, these can be quite random in content but could possibly be used to identify ‘hotspots’ of survey effort or long-term data sets.
- H: (Date of Sighting). Data are complete with no obvious date errors.
- I: (Time of Sighting). Data are incomplete (10,480 records, 7,015 blanks), 2,377 entries record a time of 00:00:00, 8,103 entries record a time of sighting.
- J: (Nearest Town). Data are incomplete (7,691 records, 9,804 blanks). This field records the town nearest to the sighting location.
- K: (Sighting County). Data are incomplete (14,279 records, 3,216 blanks). Records the county nearest to the sighting location.
- L: (Region). Data are incomplete (16,964 records, 531 blanks).
- M: (Country). Data are incomplete (16,738 records, 757 blank).
- N: (Location). Data are incomplete (15,173 records, 2,322 blank). A description of the ‘location’ at the time of sighting. These data are inconsistent and can be random in nature. For example, the field can include a detailed description of the geographic location at the time of sighting or may just record data with little information such as ‘in a bay’ or ‘on a headland’. Of the 17,495 sightings, 15,348 records have either a ‘Nearest Town’ or ‘Location’ described. A further 519 sightings have a ‘Sighting County’ attributed. A further 7 records are described as ‘at sea’ and 2 as ‘English Channel’. A further 1,619 records have no descriptive narrative.
- O to Q: Binary columns (TRUE/FALSE) to further contextualise observation as ‘in a bay’, ‘off a headland’ or ‘offshore (1nm+)’ but data are incomplete. ‘In a bay’ (12,313 binary [TRUE/FALSE] records, 5,182 blank entries), ‘off a headland’ (12,330 binary records, 5,165 blanks) and ‘offshore’ (12,313 binary records, 5,182 blanks).
- R: (Distance from shore). Data are incomplete (5,665 records, 11,830 blanks).
- S: (Other). Additional descriptions of sighting such as size of shark, activity of shark, other species present. Data are incomplete (1,167 records, 16,330 blanks).
- T to X: Geographic grid reference of sighting expressed as Ordnance Survey map reference. Data are inconsistent and incomplete. These data are deprecated in favour of fields AF (DecLatitude) and AL (DecLogitude).
- Y to AC: Geographic coordinate of sighting expressed as Latitude sub-divided into degrees, minutes, seconds and N/S suffix. Data are incomplete. These data are deprecated in favour of fields AF (DecLatitude).
- AD: (DecLatitude). Geographic coordinate of sighting expressed as decimal degrees Latitude. Data are complete.
- AE to AI: Geographic coordinate of sighting expressed as Longitude sub-divided into degrees, minutes, seconds and E/W suffix. Data are incomplete. These data are deprecated in favour of fields AL (DecLongitude).
- AJ: (DecLongitude). Geographic coordinate of sighting expressed as decimal degrees Longitude. Data are complete.
- AK and AL: (ICES Area and ICES Block). Data are incomplete, (5 records, 17,490 blanks).
- AM to AP, AR to AU. Binary columns (TRUE/FALSE) to describe weather (Sun, Fog, Overcast, Rain) and sea conditions (Calm, Rough, Moderate) at time of sighting. Data are complete up to the end of 2008. From 2009 data are incomplete.
- AQ: (Sea temperature). Data are incomplete (1,834 records, 15,661 blank entries).
- AV: (Length of sighting). Data are incomplete (3,662 records, 13,833 blank entries).
- AW to AZ, BB to BC. Binary columns (TRUE/FALSE) to describe observer activity (on land, diving/snorkelling, recreational boating, fishing boat) and supplementary data availability (more reporting cards / information) at time of sighting. Data are complete up to the end of 2008. From 2009 data are incomplete.
- BA: (Distance from animal). Data are incomplete (3,908 records, 13,587 blanks).
- BD to BG. Tag information if observed. Fields populated in 2004, 2005, 2006. Two entries in 2013.
- BH: (Marks or Scars). This field is populated up to and including 2013 (156 entries). No data after 13/09/2013 (17,339 blank entries).
- BI to BN. Binary columns (TRUE/FALSE) to describe activity of animal (Alive, Dead, Feeding, Swimming and Breaching) or presence of other animals. Data are complete up to the end of 2008. From 2009 fields are incomplete and sparsely populated.
- BO: (Other Animals Text). Data are incomplete (2,549 records, 14,946 blanks).
- BP: (Total Number of Sharks). Data are complete.
- BQ to BU. Records the number of sharks observed in size classes: 2 m or less, > 2 m to 4 m, > 4 m to 6 m, > 6 m to 8 m and > 8 m. All fields populated up to 28/05/2013. After this date fields are no longer continuously populated.
- BV. (Other Notes). 6,621 records, 10,874 blanks.
- BW. (Species). Data are complete, all entries are recorded as Basking Shark.
- BX. (Contact Method). This field is blank.
Shark Trust database 17/02/2016 to 27/10/2020
Data comprised 258 entries (rows) with 12 fields:
Combined database - spatial validation (all data)
The combined database comprised 17,697 rows: Marine Conservation Society n = 17,495, Shark Trust n = 202 (Figures 3 and 4). Of these data, n = 9,112 sightings were assigned a spatial validation confidence classification of ‘1’, n = 5,346 classification ‘2’, n = 1,527 classification ‘3’, n = 1,619 classification ‘U1’ and n = 93 classification ‘U2’ (Table 2, Figures 5, 6, 7 and 8).
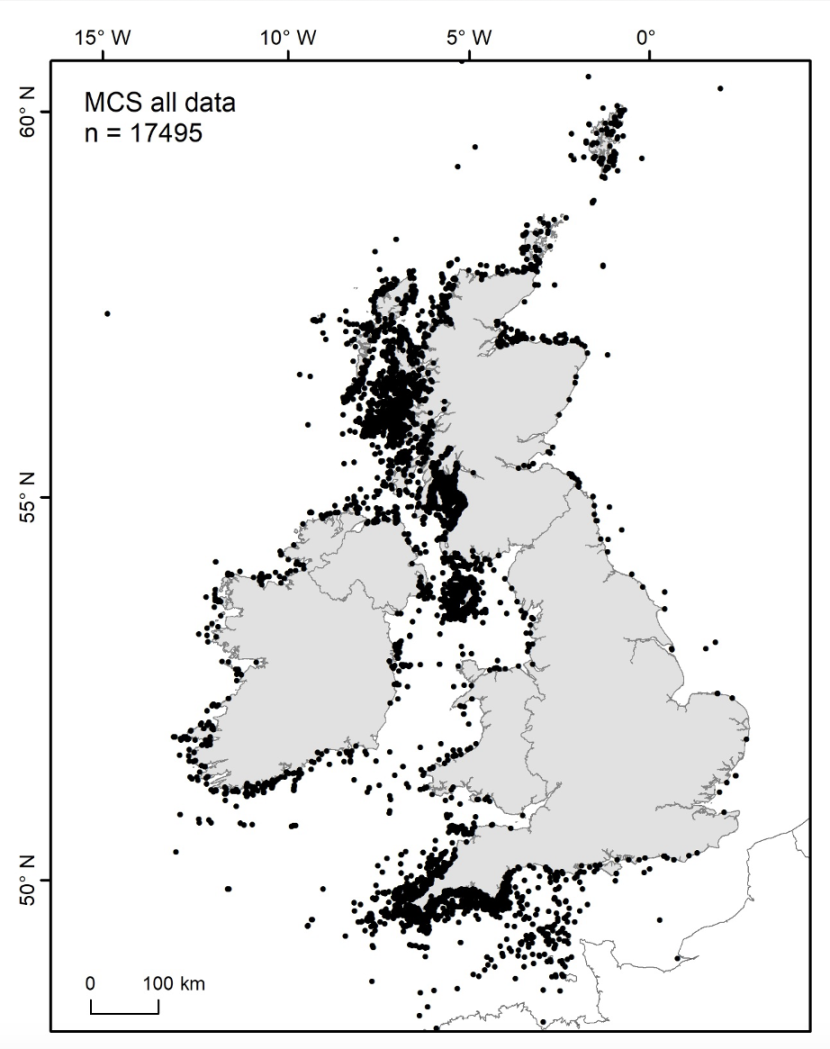
Basking shark sightings records are shown as filled black circles. Maps drawn to Projected Coordinate System: British National Grid Transverse Mercator. Contains OS data © Crown copyright and database rights (2023).
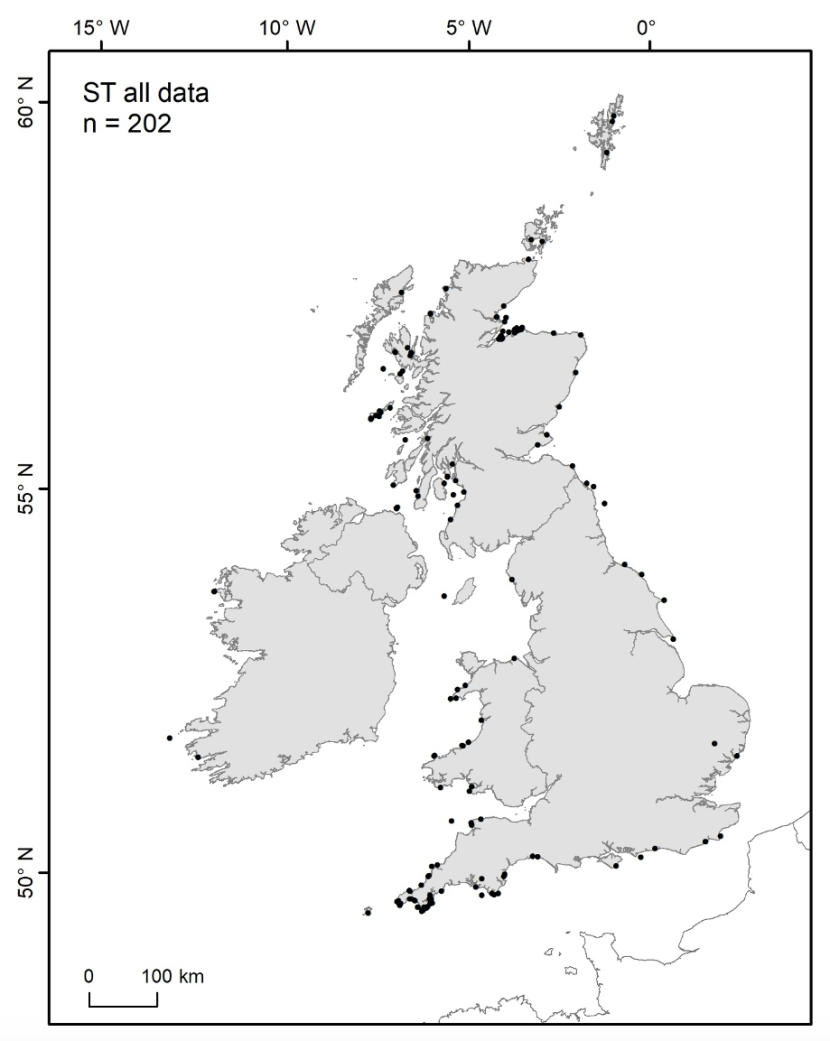
Basking shark sightings records are shown as filled black circles. Maps drawn to Projected Coordinate System: British National Grid Transverse Mercator. Contains OS data © Crown copyright and database rights (2023).
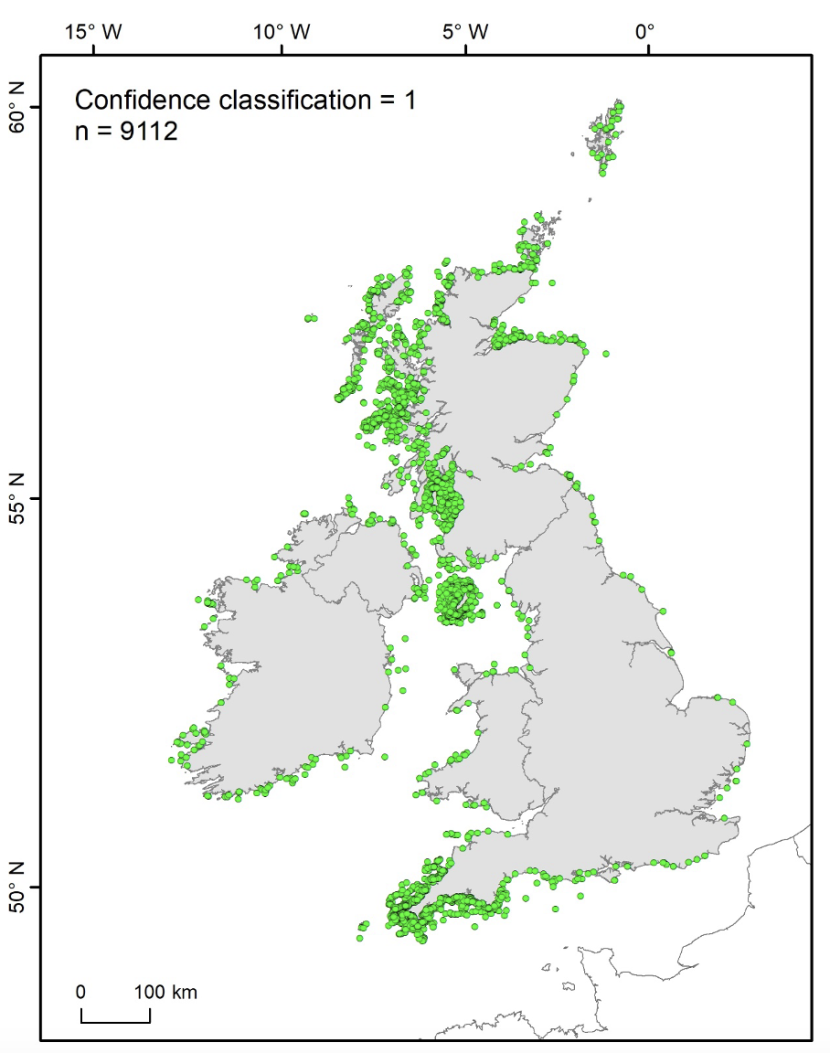
Classification 1 indicates a match was found in the place name gazetteer within a maximum distance of 50 km for ‘nearest town’ or description of sighting location, n = 9,112 records. Maps drawn to Projected Coordinate System: British National Grid Transverse Mercator. Contains OS data © Crown copyright and database rights (2023).
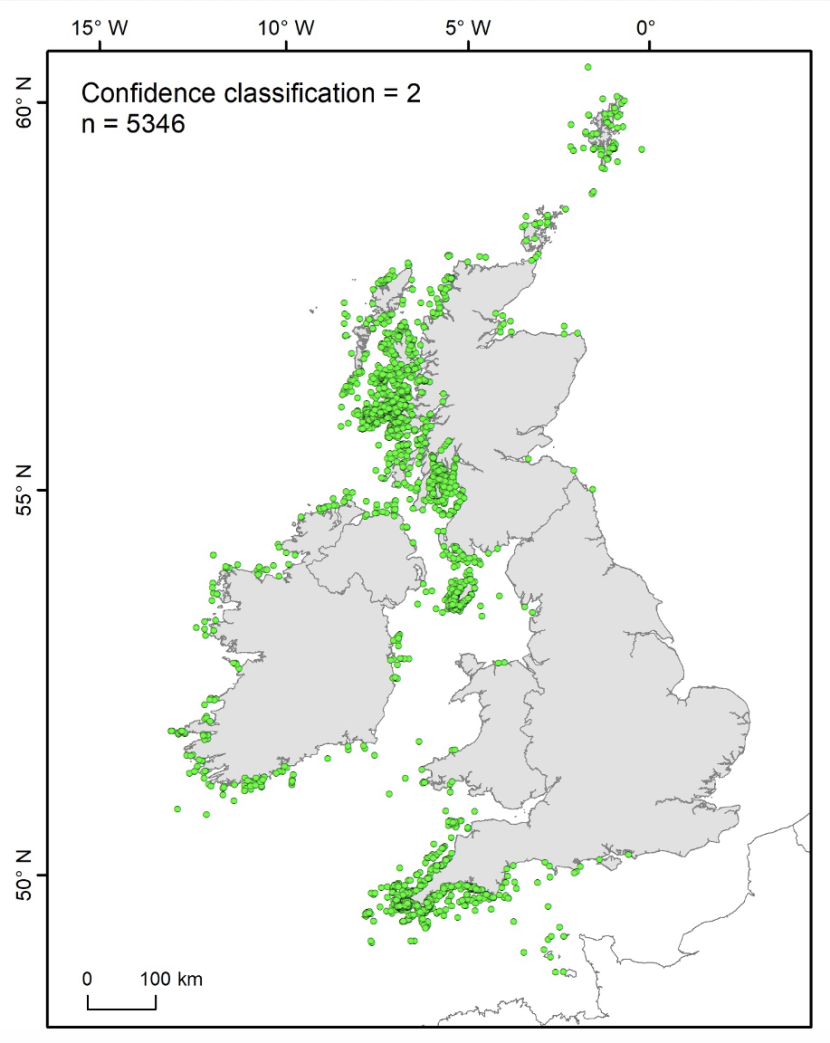
Classification 2 indicates a match was found in the place name gazetteer within a maximum distance of 50 km for County of sighting, n = 5,346 records. Maps drawn to Projected Coordinate System: British National Grid Transverse Mercator. Contains OS data © Crown copyright and database rights (2023).
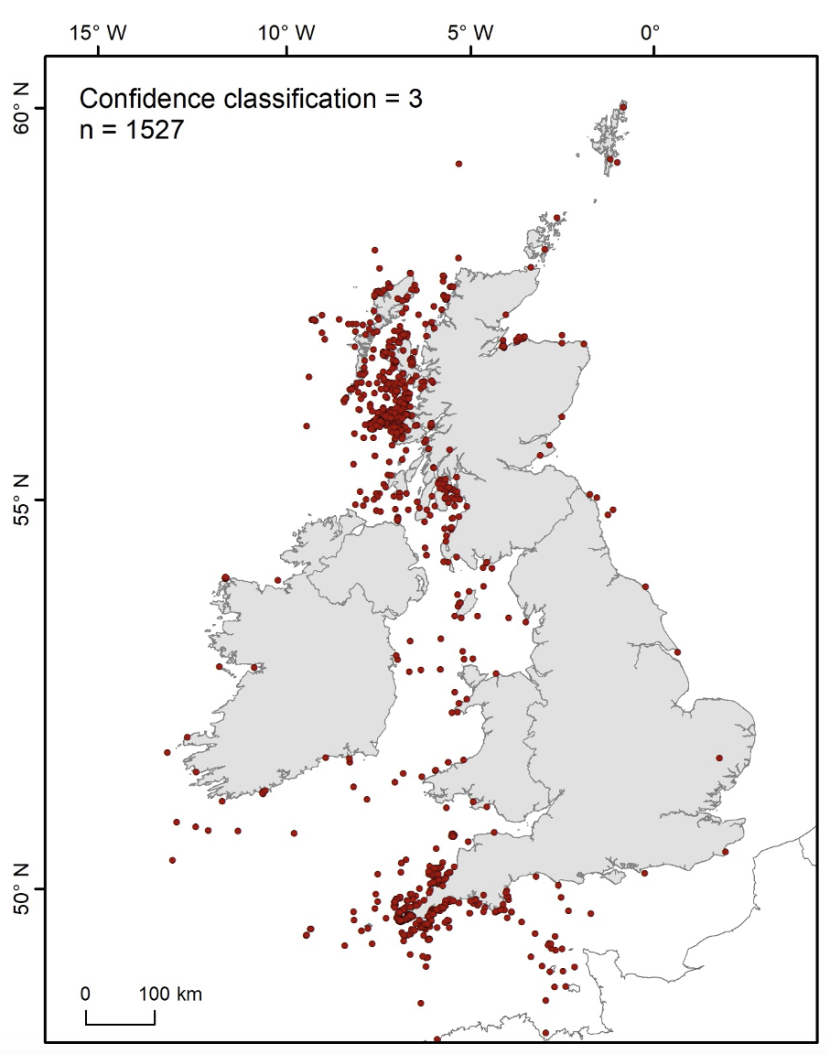
Classification 3 indicates no match was found in the place name gazetteer within a maximum distance of 50 km for ‘nearest town’, description of sighting location or county, n = 1,527. Possible reasons include: erroneous spatial reference recorded at time of sighting, or fuzzy match algorithm unable to reconcile a match between database text and gazetteer text. Maps drawn to Projected Coordinate System: British National Grid Transverse Mercator. Contains OS data © Crown copyright and database rights (2023).
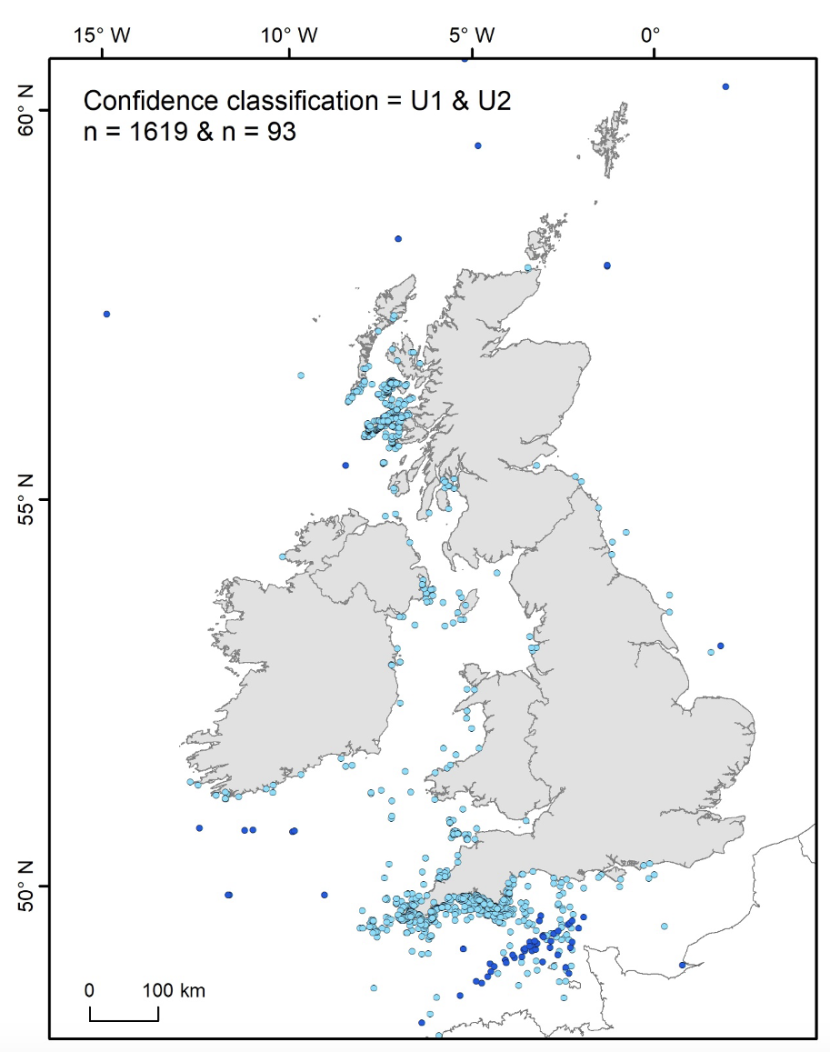
Classification U1 (light blue filled circles) represents records where no metadata were recorded in the sightings database for ‘nearest town’, description of sighting location or county, as such no match within the place name gazetteer was possible, n = 1,619 records. Classification U2 (dark blue filled circles) represents records where the sighting was spatially referenced greater than 50 km from UK / Irish coastline, as such no spatial validation was possible. However, metadata recorded in database described the sighting as occurring ‘offshore’ and/or from a vessel, n = 93 records. Maps drawn to Projected Coordinate System: British National Grid Transverse Mercator. Contains OS data © Crown copyright and database rights (2023).
Combined database - potential duplicated sightings (all data)
The 1 km threshold identified 2,171 clusters occurring across 961 days (where a cluster comprised 2 or more observations on the same day within 1 km); 1,565 clusters consisted of 2 sightings, 606 comprised 3 or more sightings (Figure 9). In total, clusters accounted for 5,774 records, of these 3,603 observations (20% of the total database [n = 17,697]) were flagged as duplicates; 14,094 (80%) records were identified as unique sightings (Figure 10 and 11).
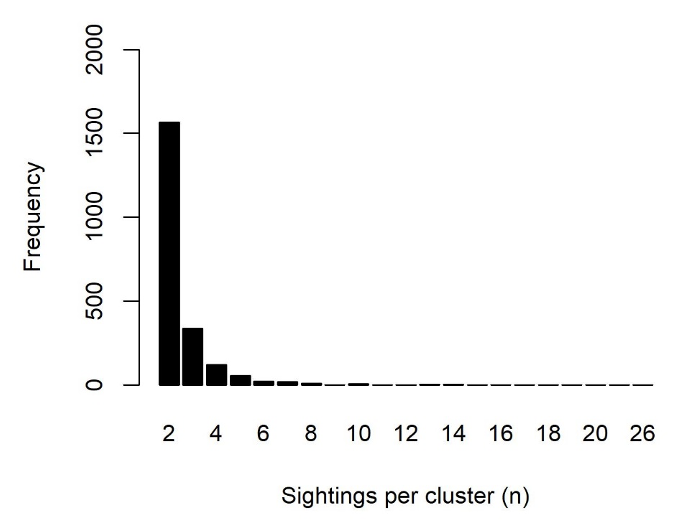
The number of sightings per cluster is given along the x axis, ranging between 2 and 26, with frequency along the y axis. The majority of clusters consisted of 2 sightings.
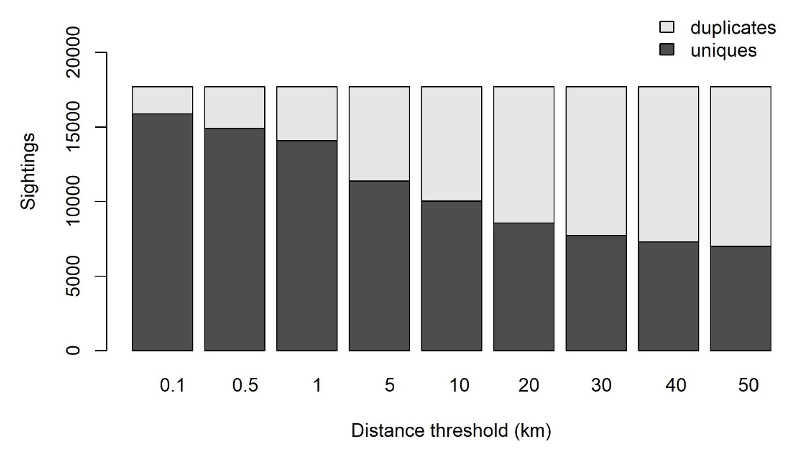
Distance threshold in km is along the x axis and number of sightings along the y axis. When the distance threshold used for identifying clusters increases the number of duplicates also increases, while the number of unique sightings decreases.
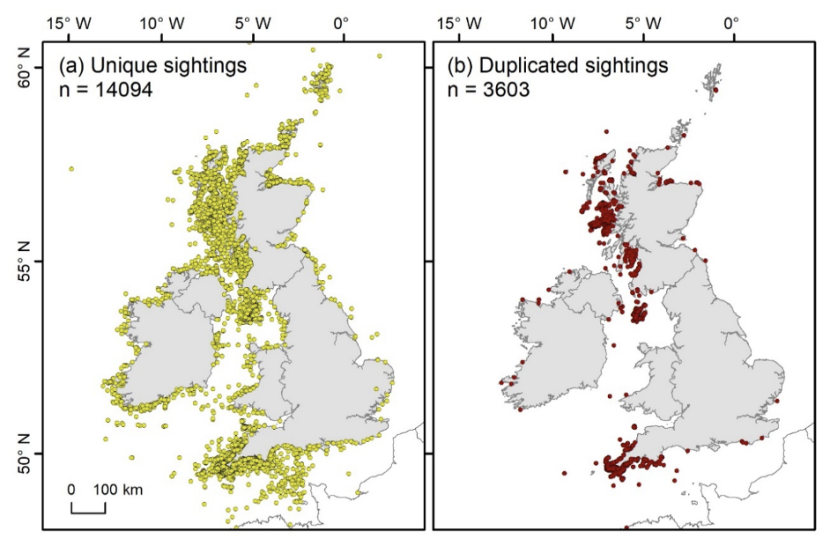
To investigate possible duplication of sightings the combined basking shark databases were analysed using spatially constrained hierarchical clustering with a 1 km distance threshold. The data base contained 14,094 unique sightings (comprising single or multiple sighting of animals) and 3,603 duplicates (repeat sightings of the same shark or duplicated entries within the database). Unique sightings are shown by filled yellow circles, duplicated sightings are shown by filled red circles. Maps drawn to Projected Coordinate System: British National Grid Transverse Mercator. Contains OS data © Crown copyright and database rights (2023).
Temporal and spatial patterns and trends
The combined database comprised 17,697 sightings records, of these n = 17,652 were spatially referenced between latitudes 49°N and 61°N, and longitude 5°E and 12°W. With the removal of spatial validation confidence class 3 records (n = 1,517) and duplicated sightings (n = 3,257), a total of 12,878 remained for temporal and spatial analysis.
Time-series analysis indicated that surface sightings of basking sharks remained fairly constant from 1987 to 2003. Peak years for sightings were 2004 to 2013. Since 2014 sightings have notably decreased. These annual time-series patterns broadly remain when data are apportioned by regional areas (Figures 12, 13 and 14).
Monthly patterns of basking shark surface sightings indicated that peak months for sightings were May through to September. There was evidence for some regional variation with sightings recorded earlier in the season in the south of the UK (Figures 15 and 16).
The 10th and 90th percentile day of sightings in each year across the UK remained relatively stable (Figure 17); however, from 2014 onwards the duration of the sighting season appears to have broadened (i.e. the 10th percentile day has become earlier and the 90th percentile day has become later). This more recent broadening may result from the dramatically fewer observations in more recent years (Figure 12). Any observed phenological change in records should therefore be treated with caution.
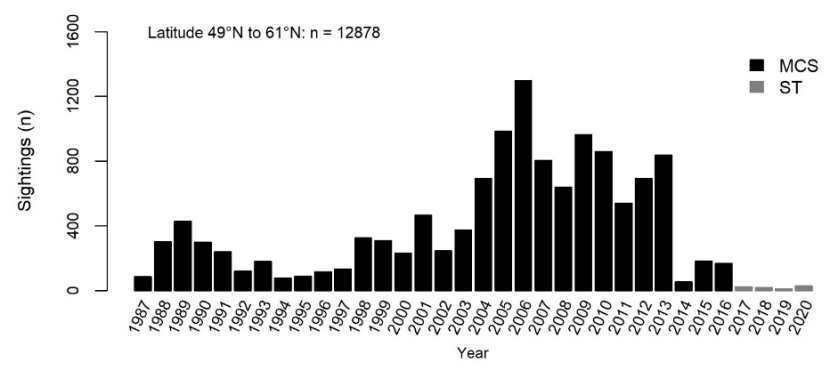
Duplicated sightings were removed using spatially constrained hierarchical clustering with a 1 km threshold applied. MCS database (black bars), ST database (grey bars).
Year is along the x axis from 1987 to 2020, with number of sightings along the y axis.
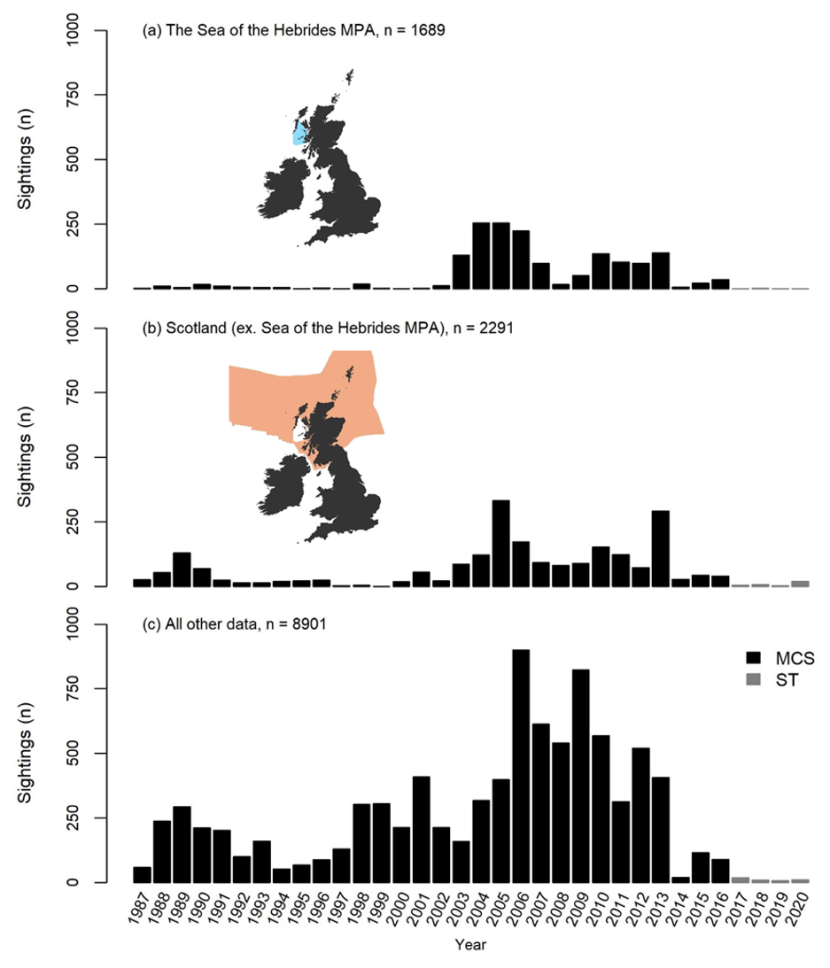
(a) Sea of the Hebrides MPA, (b) Scotland (excluding sightings from the Sea of the Hebrides MPA) and (c) all other data (excluding data from the Sea of the Hebrides MPA and Scotland). Duplicated sightings were removed using spatially constrained hierarchical clustering with a 1 km threshold applied. MCS database (black bars), ST database (grey bars). See insets of Figure 13 (a) and (b), and Figure 2 for spatially explicit boundaries for the Sea of the Hebrides MPA and Scottish waters used to apportion data. Contains OS data © Crown copyright and database rights (2023).
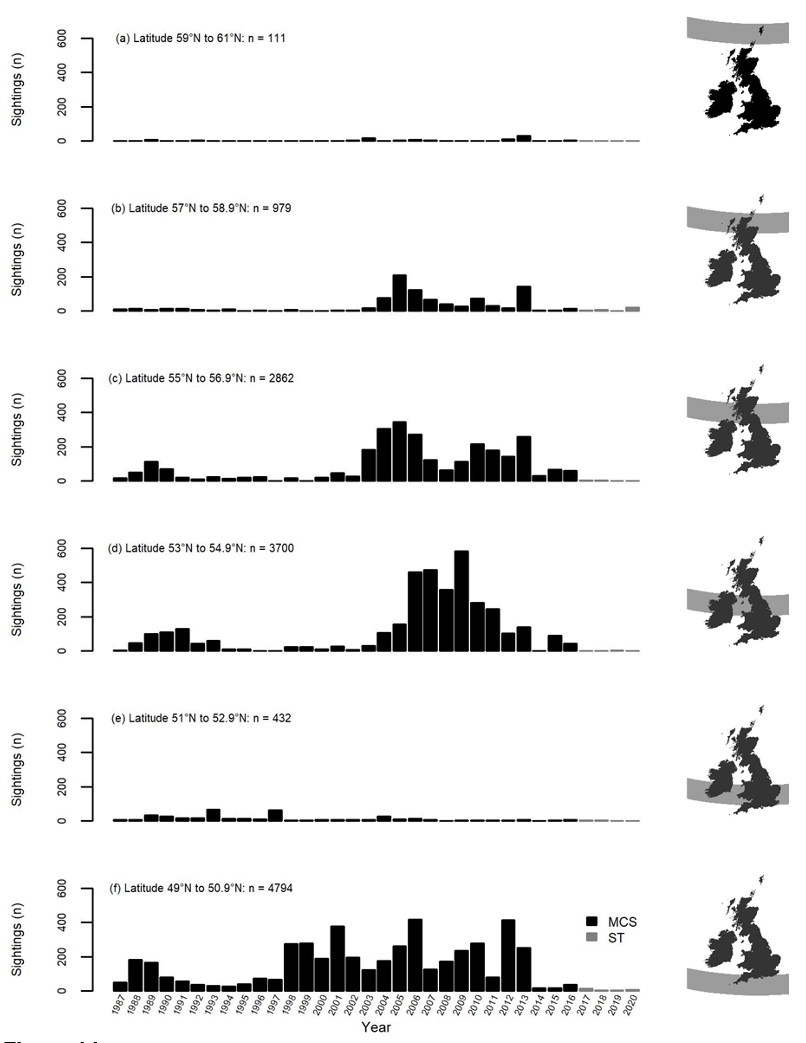
Data were apportioned by 2-degree latitudinal banding between latitudes 49°N and 61°N (see Figure 14 insets and Figure 2). Duplicated sightings were removed using spatially constrained hierarchical clustering with a 1 km threshold applied. MCS database (black bars), ST database (grey bars). Contains OS data © Crown copyright and database rights (2023).
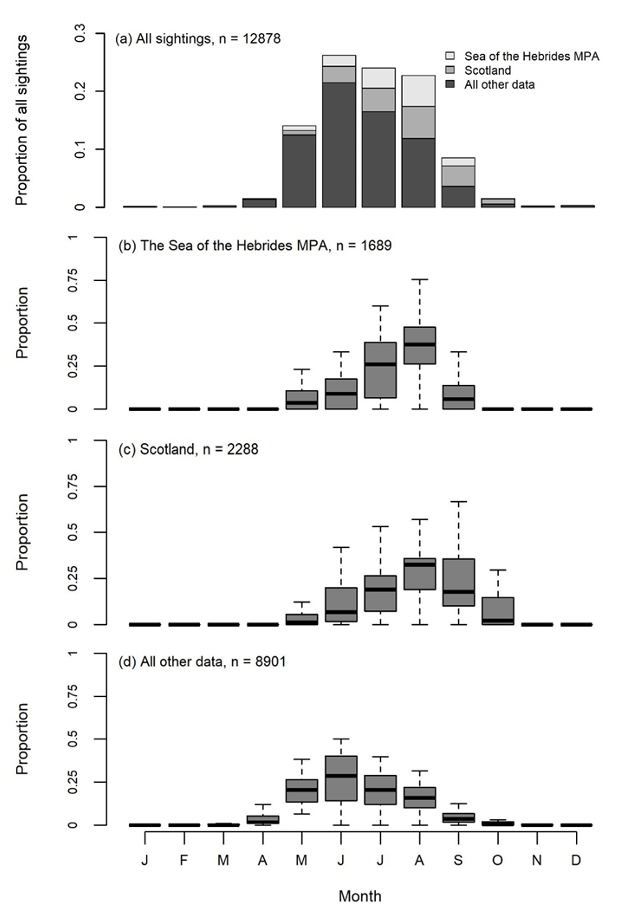
(a) Proportion of sightings by month for the Sea of the Hebrides MPA, Scotland and all other data expressed as a proportion of all sightings. Sea of the Hebrides MPA (light grey bars, n = 1,689), Scotland (excluding sightings from the Sea of the Hebrides: dark grey bars, n = 2,288) and all other data (excluding data from the Sea of the Hebrides MPA and Scotland: black bars, n = 8,901). Seasonality of sightings (b), (c) and (d). Box plots describe 25th, 50th (bold horizontal line; median) and 75th percentiles of the proportion of records occurring in each month between 1987 and 2020 for (a) Sea of the Hebrides MPA, (b) Scotland and (c) all other data, outliers are not drawn. For all plots data comprise filtered basking shark surface sighting records spatially referenced between latitudes 49°N and 61°N, and longitude 5°E and 12°W with confidence classifications 1, 2, U1 and U2. Duplicated sightings were removed using spatially constrained hierarchical clustering with a 1 km threshold applied. See Figure 2 for spatially explicit boundaries for the Sea of the Hebrides MPA and Scottish waters. Contains OS data © Crown copyright and database rights (2023).
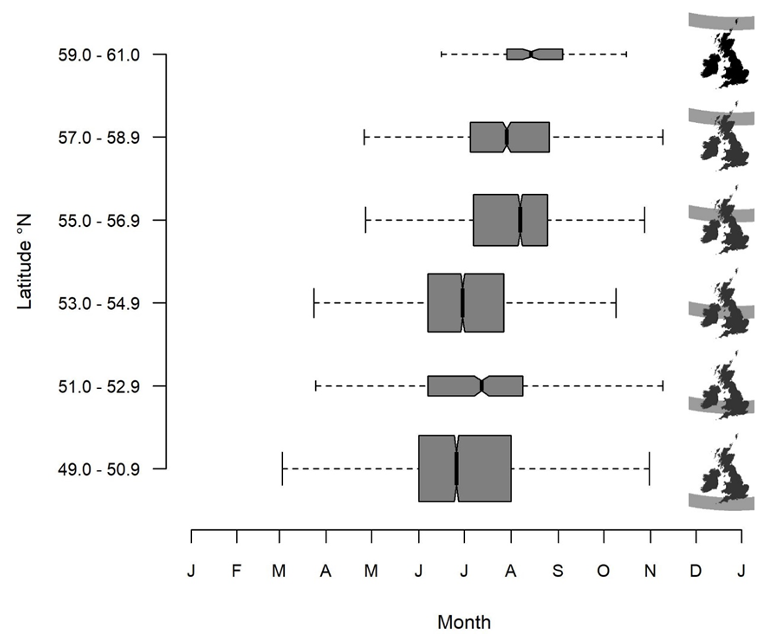
Data comprise surface sightings spatially referenced between latitudes 49°N and 61°N, and longitude 5°E and -12°W with confidence classifications 1, 2, U1 and U2. Data were apportioned by 2-degree latitudinal band between latitudes 49°N and 61°N (see Figure 2). Each box describes median (vertical bold line) day of sighting. Seasonal inter-quartile ranges (25th and 75th percentiles) are described by the box limits. Box widths are proportional to the square-roots of the number of observations in the box, outliers are not drawn. Contains OS data © Crown copyright and database rights (2023).
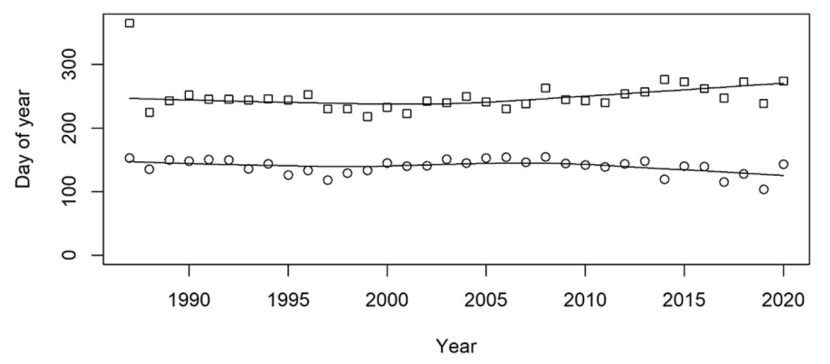
Locally estimated scatterplot smoothing for respective timeseries (LOESS; bandwidth = 0.66; solid lines).
Year (1987 – 2020) is along the x axis with day of year along the y axis.
Density mapping revealed three distinct regions where surface sightings were at their greatest: western Scotland (including the Sea of the Hebrides MPA), the Isle of Man and southwest England (Figure 18 and 19).
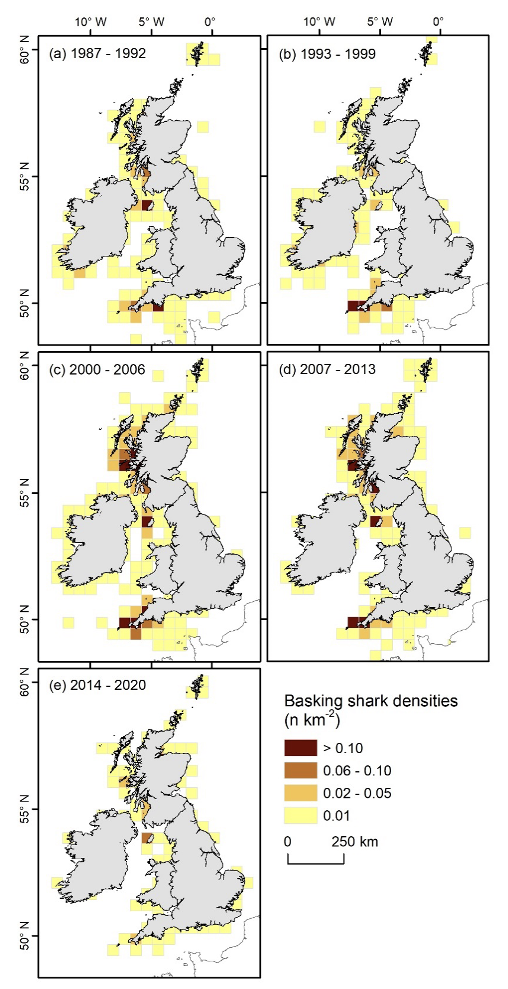
Filtered basking shark sightings were summed using a 50 x 50 km sampling grid, corrected for coincident sea area and apportioned for the years: (a) 1987 to 1992, (b) 1993 to 1999, (c) 2000 to 2006, (d) 2007 to 2013 and (e) 2014 to 2020. Data comprise surface sightings spatially referenced between latitudes 49°N and 61°N, and longitude 5°E and 12°W with confidence classifications 1, 2, U1 and U2. All grid counts are drawn using the same standardised classified colour ramp (lowest densities: yellow, greatest densities: brown) as detailed in the figure legend. Maps drawn to Projected Coordinate System: British National Grid Transverse Mercator. Contains OS data © Crown copyright and database rights (2023).
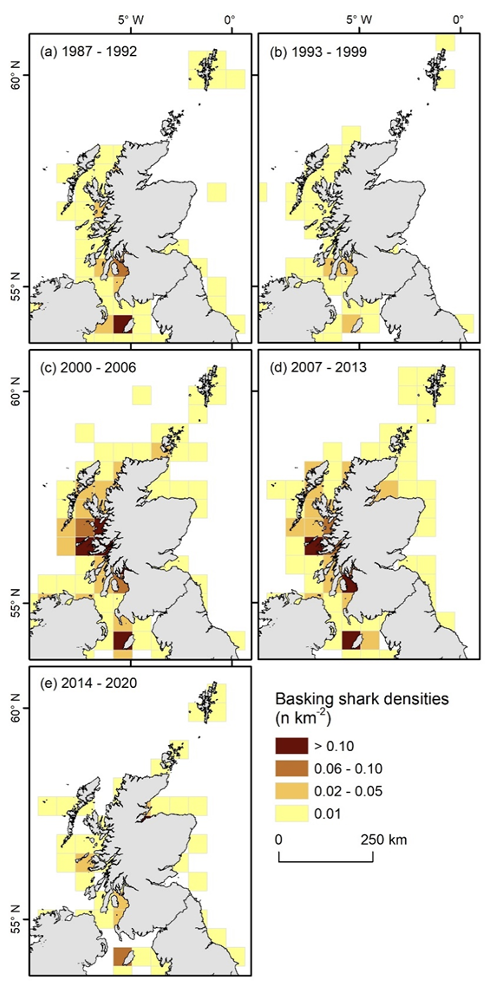
Filtered basking shark sightings were summed using a 50 x 50 km sampling grid, corrected for coincident sea area and apportioned for the years: (a) 1987 to 1992, (b) 1993 to 1999, (c) 2000 to 2006, (d) 2007 to 2013 and (e) 2014 to 2020. Data comprise surface sightings with confidence classifications 1, 2, U1 and U2. All grid counts are drawn using the same standardised classified colour ramp (lowest densities: yellow, greatest densities: brown) as detailed in the figure legend. Maps drawn to Projected Coordinate System: British National Grid Transverse Mercator. Contains OS data © Crown copyright and database rights (2023).
Discussion
Database audit and metadata
The Basking Shark Watch sightings scheme has been in existence since 1987 and has been managed by both the Marine Conservation Society and the Shark Trust. Over the last 33 years the database has recorded 17,697 surface sightings of basking sharks. Reporting methods used to compile the database have developed over time. Data were initially entered into the database having been transcribed from post/email or telephone reports. In more recent years, data have been assimilated through two online sightings portals. This on-going development of the scheme has resulted in many data fields not being fully complete. The fields which were fully populated within the original database include: date of sighting, geographic coordinate of sighting expressed as decimal degrees latitude and longitude and number of animals sighted. Fully populated fields appended during this project include: year of sighting, database source (i.e. Marine Conservation Society or Shark Trust), distance from UK/Irish coastline, alphanumeric spatial validation confidence classification, and a binary (true/false) field to identify potential unique (non-duplicated) sightings (using 1 km distance threshold). These data fields (see Annex 1) would represent the most ‘complete’ set of data that could be made available online. Other fields that may be considered for inclusion online include all Shark Trust fields (as these are ongoing) and, whilst not being fully populated, all fields from the Marine Conservation Society database used to inform the current analysis.
The latest version of the online data portal managed by the Shark Trust comprises fewer data fields than the original Marine Conservation Society database, see section 3.1.2. From the perspective of ‘public interaction’ with the database when reporting a sighting this is probably desirable, and much of the information potentially captured could be useful for future analysis. However, from examining the portal it appears that completion of some fields is not mandatory. For future completeness of the scheme mandatory completion of all fields would be advantageous. Similarly, whilst not wishing to overly add to the complexity of the portal, data describing ‘animal activity’ (e.g. breeching, feeding) together with an estimate of size class may prove useful for future analysis and build on previous data collected by the Marine Conservation Society database.
Time-series and seasonality analysis
Annual time-series and seasonality analyses were performed following the removal of records with low confidence (9% of combined database) or records that may have been duplicates (18%), leaving 73% of the records for analysis. Interpretation of public sightings data should be made with caution as data lack information on observer effort (Witt et al., 2012). However, where such data are gathered in sufficient quantity, and can be satisfactorily validated, these may provide useful insights into spatial/temporal patterns and trends (Pikesley et al., 2012, 2014, 2016; Witt et al., 2012).
Annual time-series analysis for the study period (1987 to 2020, 33 years) showed an initial peak in sightings (1989) followed by a reduced level of sightings over much of the following decade. Sightings increased during the early 2000s reaching a peak in 2006 and remaining comparatively high during the latter part of the decade. Since 2014, sightings of basking sharks have dramatically reduced, with 2017 to 2020 having fewer recorded sightings than 1987 (the first year that the sightings database was initiated, Figure 12). These annual time-series patterns broadly remain when data are apportioned into regional areas (Figure 13). However, when annual time-series data were apportioned by latitudinal band, it would appear that the peak in records during the 2000s was primarily driven by sightings within latitudes 53°N to 54.9 °N, probably largely attributable to sightings from the Isle of Man (Figure 14). This analysis also indicates that comparatively few basking shark sightings are recorded between latitudes 51°N to 52.9 °N (north Celtic Sea and Irish Sea) and 59 °N to 61 °N (Orkney and Shetland Islands). Density maps (Figures 17 and 18) highlight three distinct regions where surface sightings were at their greatest, and further emphasise the recent decline in surface sighting throughout UK coastal waters. These data also demonstrate the temporal variability in densities among regions.
Peak months for recorded basking shark sightings were May to September. There was evidence for a greater relative proportion of sightings within English/Irish waters at the beginning of the season, with this proportion decreasing as the relative proportion of sightings increased to the north of the study area (the Sea of the Hebrides and Scottish waters) later in the season (Figure 15a). Peak month for sightings in English/Irish waters was June; and August for the Sea of the Hebrides and Scottish waters (Figures 15 b, c and d). There was greater variability in the proportion of records by month for the Sea of the Hebrides and Scottish waters when compared to English/Irish waters, however this may be attributable to the smaller sample size from these locations. These monthly patterns in seasonality were broadly similar when data were further apportioned by latitudinal band (Figure 16).
The presented analysis of the Basking Shark Watch (BSW) database (1987 to 2020) would suggest that whilst there was some regional variation, surface sightings were at their greatest during the first decade of the 2000s, but that since 2014 sightings have notably declined. The drivers behind this apparent decline are difficult to quantify. Whilst a decline in recorded surface sightings may indicate a decline in species, it could also be indicative of a decline in public willingness or recognition to report sightings. The BSW database is primarily driven by public sightings, and as such public knowledge of the existence of the database, and access to it, are key to its success. Consistency in management (uniformity in promotion to publicise reporting scheme year on year together with ease of reporting for general public) could be crucial to the scheme. However, whilst the issue of survey effort may complicate time-series analysis, it is far less likely to have an impact on any seasonal patterns that may be detected within these data.
Possible future analysis
Further analysis integrating/comparing other datasets may help improve/reduce uncertainty in public sightings data findings. Spatio-temporal patterns revealed by public sightings could be validated against satellite tracking data (light geolocation) and formal wildlife surveys (e.g. HWDT). These data may enable corroboration of seasonality (do tracked shark locations mirror seasonal patterns seen in public sightings?) or annual time-series patterns (do the peaks and troughs in the annual counts in the public data match the formal surveys?).
Long-term drivers affecting population trajectory (i.e. more or less sharks) and phenology (i.e. seasonal arrival and departure data) could be investigated. Spatio-temporal environmental data describing water column stratification, temperature and food availability could be coupled with sightings data. Analysis could be achieved with both the public sightings, formal survey data and the tracking data, and then cross reference to check they reveal the same relationships with environmental drivers.
Database future
The BSW public sightings database represents a vast repository for surface sightings of basking sharks, primarily in UK coastal waters, gathered over more than three decades. Whilst the custodian of the scheme has changed during this time, the rationale behind the scheme (to provide an indication of seasonality and distribution of sightings) has not. With the advent of online reporting portals the scheme has never been easier for the public to engage with, and as such consideration as to how the scheme should be promoted publicly is likely to be key to its future utility. Furthermore, cross validating spatio-temporal patterns derived from public sightings data would increase confidence in patterns seen on a wider spatial scale and potentially enable these data to be incorporated into monitoring and management of basking sharks within the context of future regional marine spatial planning throughout UK coastal waters.
References
Hijmans, R. J., Williams, E., Vennes, C., and Hijmans, M. R. J. 2017. Package ‘geosphere’. Spherical Trigonometry, 1(7).
Pikesley, S. K., Godley, B. J., Latham, H., Richardson, P. B., Robson, L. M., Solandt, J.-L., Trundle, C., Wood, C., and Witt, M. J. 2016. Pink sea fans (Eunicella verrucosa) as indicators of the spatial efficacy of Marine Protected Areas in southwest UK coastal waters. Marine Policy, 64, 38–45.
Pikesley, S. K., Godley, B. J., Ranger, S., Richardson, P. B., and Witt, M. J. 2014. Cnidaria in UK coastal waters: Description of spatio-temporal patterns and inter-annual variability. Journal of the Marine Biological Association of the United Kingdom, 94(07), 1401–1408.
Pikesley, S. K., Witt, M. J., Hardy, T., Loveridge, J., Loveridge, J., Williams, R., and Godley, B. J. 2012. Cetacean sightings and strandings: Evidence for spatial and temporal trends? Journal of the Marine Biological Association of the United Kingdom, 92(8), 1809–1820.
Southall, E. J., Sims, D. W., Witt, M. J., and Metcalfe, J. D. 2006. Seasonal space-use estimates of basking sharks in relation to protection and political–economic zones in the North-east Atlantic. Biological Conservation, 132(1), 33–39.
Witt, M. J., Hardy, T., Johnson, L., McClellan, C. M., Pikesley, S. K., Ranger, S., Richardson, P. B., Solandt, J.-L., Speedie, C., and Williams, R. 2012. Basking sharks in the northeast Atlantic: Spatio-temporal trends from sightings in UK waters. Marine Ecology Progress Series, 459, 121–134.
Annex 1 - Basking Shark Watch database fields over the period 1987 to 2020 and recommendations for ongoing collection
Annex 1 provides examples of the full combined list of Basking Shark Watch database fields collected over the period 1987 to 2020. Reporting methods used to compile the Basking Shark Watch database have developed over the last 33 years and this has resulted in changes to the collected data fields over time. The following data fields are recommended as priorities for ongoing data collection:
- fully populated data fields from the combined database, and fully populated data fields which have been appended during this project (marked # in table).
- Marine Conservation Society fields which were used to inform the current analysis (marked § in table)
- all ongoing Shark Trust data fields from the current data entry portal (marked ‡ in table)
- in addition data to describe ‘animal activity’ (e.g. breeching, feeding) together with an estimate of size class may prove useful for future analyses (marked * in table)
|
B |
C |
D |
E |
F |
G |
H |
I |
|
|---|---|---|---|---|---|---|---|---|
|
N° |
Year |
Date of Report |
Received by - Report card |
Received by - Email |
Received by - Telephone |
Source of Survey |
Date of Sighting # |
Time of Sighting |
|
6 |
1987 |
26/05/1987 |
FALSE |
FALSE |
FALSE |
- |
26/05/1987 |
- |
|
21 |
1987 |
03/07/1987 |
FALSE |
FALSE |
FALSE |
- |
03/07/1987 |
- |
|
2583 |
1998 |
20/05/1998 |
FALSE |
FALSE |
FALSE |
- |
20/05/1998 |
- |
|
44 |
1987 |
01/08/1987 |
FALSE |
FALSE |
FALSE |
- |
01/08/1987 |
- |
|
1681 |
1993 |
25/10/2004 |
FALSE |
TRUE |
FALSE |
contacted by MCS |
30/05/1993 |
- |
|
J |
K |
L |
M |
N |
|---|---|---|---|---|
|
Nearest Town § |
Sighting County § |
Region |
Country |
Location § |
|
Milford on Sea |
Hampshire |
Southeast England |
England |
Milford on Sea |
|
- |
Western Isles |
West Scotland |
Scotland |
Hebrides |
|
- |
Cornwall |
Southwest England |
England |
- |
|
- |
- |
Southwest England |
England |
- |
|
- |
Cork |
Ireland |
Ireland |
Kinsale |
|
O |
P |
Q |
R |
S |
T |
U |
V |
|
In a Bay |
Off a headland |
Offshore (1nm+) |
Distance from Shore (m/nm) |
Other |
OS |
OS LET |
OS nos |
|
FALSE |
FALSE |
FALSE |
- |
- |
- |
- |
- |
|
FALSE |
FALSE |
FALSE |
- |
- |
- |
- |
- |
|
FALSE |
FALSE |
FALSE |
- |
- |
- |
- |
- |
|
FALSE |
FALSE |
FALSE |
- |
- |
- |
- |
- |
|
FALSE |
FALSE |
FALSE |
- |
- |
- |
- |
- |
|
W |
X |
Y |
Z |
AA |
AB |
AC |
|---|---|---|---|---|---|---|
|
Eastings |
Northings |
Latitude |
Lat degrees |
Lat mins |
Lat secs |
N-S |
|
- |
- |
50 42 30 N |
50 |
42 |
30 |
N |
|
- |
- |
55:40:39N |
55 |
40 |
39 |
N |
|
- |
- |
50:50:1N |
50 |
50 |
1 |
N |
|
- |
- |
50:18:46N |
50 |
18 |
46 |
N |
|
- |
- |
51.4 |
51 |
4 |
- |
- |
|
AD |
AE |
AF |
AG |
AH |
AI |
AJ |
|---|---|---|---|---|---|---|
|
DecLatitude # |
Longitude |
Longdeg |
Longmins |
Longsecs |
E-W |
DecLongitude # |
|
50.70833333 |
1373W |
1 |
37 |
3 |
W |
-1.6175 |
|
55.6775 |
6:32:3W |
6 |
32 |
3 |
W |
-6.534167 |
|
50.83361111 |
- |
5 |
36 |
54 |
W |
-5.615 |
|
50.31277778 |
4:31:42W |
4 |
31 |
42 |
W |
-4.528333333 |
|
51.06666667 |
8.3 |
8 |
3 |
- |
- |
-8.05 |
|
AK |
AL |
AM |
AN |
AO |
AP |
AQ |
AR |
|---|---|---|---|---|---|---|---|
|
ICES Area |
ICES Block |
Weather Conditions - Sun |
Weather Conditions - Fog |
Weather Conditions - Overcast |
Weather Conditions - Rain |
Sea Temperature (C) |
Water Conditions - Calm |
|
- |
- |
FALSE |
FALSE |
FALSE |
FALSE |
- |
TRUE |
|
- |
- |
FALSE |
FALSE |
TRUE |
FALSE |
- |
FALSE |
|
- |
- |
FALSE |
FALSE |
FALSE |
FALSE |
- |
TRUE |
|
- |
- |
FALSE |
FALSE |
FALSE |
FALSE |
- |
FALSE |
|
- |
- |
FALSE |
FALSE |
FALSE |
FALSE |
- |
FALSE |
|
AS |
AT |
AU |
AV |
AW |
AX |
AY |
AZ |
|---|---|---|---|---|---|---|---|
|
Water Conditions - Rough |
Water Conditions - Moderate |
Weather/Water Conditions - Other |
Length of Sighting (mins) |
Were You - On Land |
Were You - Diving/ snorkelling |
Were You - On a boat Recreation |
Were You - On a boat Fishing |
|
FALSE |
FALSE |
- |
- |
FALSE |
FALSE |
FALSE |
FALSE |
|
FALSE |
FALSE |
- |
- |
FALSE |
FALSE |
TRUE |
FALSE |
|
FALSE |
FALSE |
- |
- |
FALSE |
FALSE |
FALSE |
FALSE |
|
FALSE |
FALSE |
- |
- |
FALSE |
FALSE |
TRUE |
FALSE |
|
FALSE |
FALSE |
- |
- |
FALSE |
FALSE |
TRUE |
FALSE |
|
BA |
BB |
BC |
BD |
BE |
BF |
BG |
BH |
|---|---|---|---|---|---|---|---|
|
Distance from animals |
More reporting cards? |
More information? |
Visible Tags |
Colour of Tag |
Number/Code on Tag |
Position of Tag |
Marks or Scars |
|
- |
FALSE |
FALSE |
FALSE |
- |
- |
- |
- |
|
- |
FALSE |
FALSE |
FALSE |
- |
- |
- |
- |
|
- |
FALSE |
FALSE |
FALSE |
- |
- |
- |
- |
|
- |
FALSE |
FALSE |
FALSE |
- |
- |
- |
- |
|
- |
FALSE |
FALSE |
FALSE |
- |
- |
- |
- |
|
BI |
BJ |
BK |
BL |
BM |
BN |
BO |
BP |
|---|---|---|---|---|---|---|---|
|
Alive |
Dead |
Feeding* |
Swimming* |
Breaching* |
Other Animals |
Other Animals Text |
Total Number of Sharks # |
|
TRUE |
FALSE |
FALSE |
FALSE |
FALSE |
FALSE |
- |
1 |
|
TRUE |
FALSE |
FALSE |
FALSE |
FALSE |
FALSE |
- |
1 |
|
TRUE |
FALSE |
FALSE |
FALSE |
FALSE |
FALSE |
- |
1 |
|
TRUE |
FALSE |
TRUE |
FALSE |
FALSE |
FALSE |
- |
5 |
|
TRUE |
FALSE |
FALSE |
FALSE |
FALSE |
FALSE |
- |
6 |
|
BQ |
BR |
BS |
BT |
BU |
BV |
|---|---|---|---|---|---|
|
Number 2m (6ft) or Less* |
Number 2-4m (6-13ft) * |
Number 4-6m (13-20ft) * |
Number 6-8m (20-26ft) * |
Number Over 8m (26ft+)* |
Other Notes |
|
0 |
1 |
0 |
0 |
0 |
- |
|
0 |
0 |
0 |
0 |
0 |
- |
|
0 |
0 |
0 |
0 |
0 |
- |
|
0 |
0 |
0 |
0 |
0 |
- |
|
0 |
0 |
0 |
0 |
0 |
- |
|
BW |
BX |
BY |
BZ |
CA |
CB |
|---|---|---|---|---|---|
|
Species‡ |
Contact Method |
Confidence (ST) ‡ |
Status (ST) ‡ |
Ocean (ST) ‡ |
Year of Sighting # |
|
Basking Shark |
- |
- |
- |
- |
1987 |
|
Basking Shark |
- |
- |
- |
- |
1987 |
|
Basking Shark |
- |
- |
- |
- |
1998 |
|
Basking Shark |
- |
- |
- |
- |
1987 |
|
Basking Shark |
- |
- |
- |
- |
1993 |
|
CC |
CD |
CE |
CF |
CG |
CH |
|---|---|---|---|---|---|
|
Database # |
Distance from UK/IRL coastline (km) # |
On land |
At sea (EEZ) |
Spatial validation confidence class # |
Unique sighting (1km) # |
|
MCS |
1.9 |
FALSE |
GBR |
1 |
TRUE |
|
MCS |
0.9 |
FALSE |
GBR |
2 |
TRUE |
|
MCS |
50.5 |
FALSE |
GBR |
3 |
TRUE |
|
MCS |
1.4 |
FALSE |
GBR |
U1 |
TRUE |
|
MCS |
68.8 |
FALSE |
IRL |
U2 |
TRUE |
